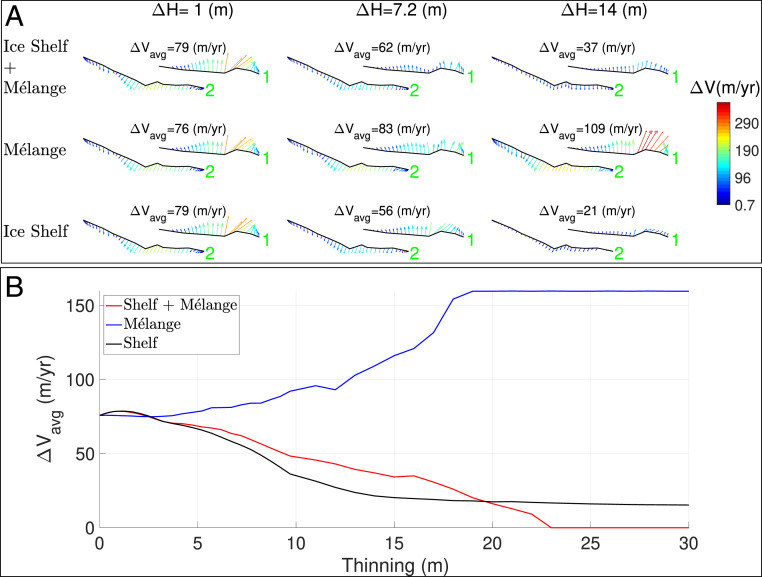
Fig. 3.
(A and B) Modeling of the combined opening rate, (m/y), of rifts 1 and 2 (see Fig. 2 for the numbering of rifts) on Larsen C Ice Shelf, Antarctica with three scenarios: 1) thinning of the ice shelf and ice mélange (ice shelf + mélange), 2) thinning of the mélange only (mélange), and 3) thinning of the ice shelf only (ice shelf) and three values of forced thinning: H = 1, 7.2, and 14 m. The magnitude of the flank-to-flank opening rate is color coded from 0.48 to 350 m/y from blue to red in A, with a direction of opening indicated by an arrow. The opening rate of rifts 1 and 2 as a function of thinning from 0 to 30 m is shown in B for the three scenarios.

