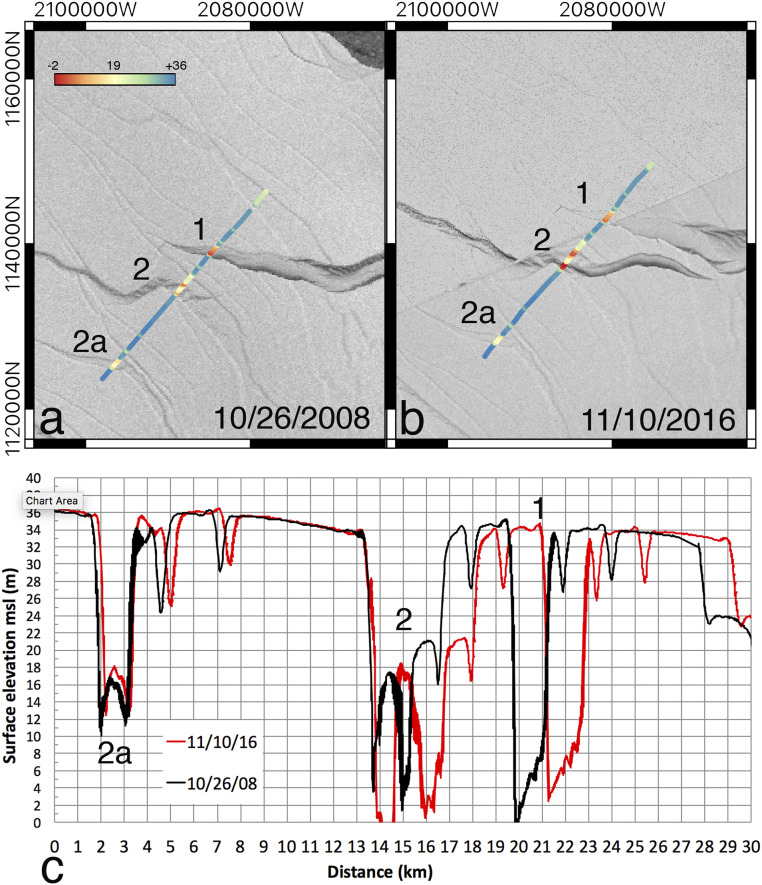
Fig. 4.
(A and B) Surface elevation (in meters above sea level) from Operation IceBridge laser altimetry in (A) 26 October 2008 versus (B) 10 November 2016 across the rifted zone of Larsen C, with annotated rifts 1, 2, and 2a from Fig. 1. (C) Comparison of the elevation profiles after adjustment for the 8-y motion of the ice at starting point near rift 2a versus distance (toward the north) in kilometers. Background radar imagery is from Envisat ASAR in 2008 and Sentinel-1a SAR in 2016.

