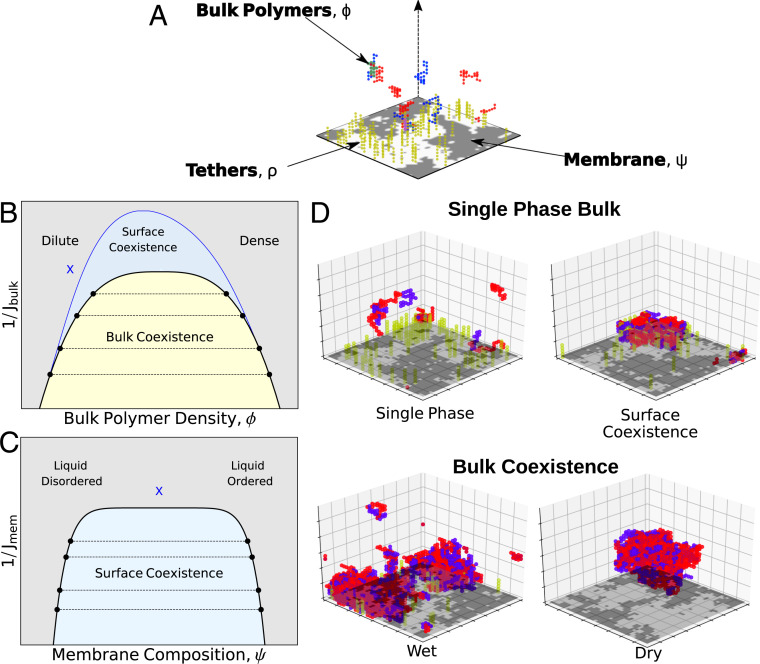
Fig. 1.
Bulk and surface phases: (A) Cartoon of the minimal model used to describe surface densities. In our simulations red and blue lattice polymers have an attractive interaction in the three-dimensional bulk. An Ising model on the bulk’s boundary contains bright/dark pixels representing liquid ordered/disordered preferring components of a membrane. Tethers (yellow polymers) are connected to up spins and have an attractive interaction with components of the bulk. (B) Schematic bulk phase diagram. On a plot of inverse interaction strength (like temperature) vs. polymer density, the bulk phase diagram contains a single bulk phase region (blue and gray) and a region where a dense phase and a dilute phase coexist (yellow). The shape of the bulk coexistence curve does not depend on location within the surface phase diagram. (C) The region of surface coexistence depends on both bulk and surface parameters. In B and C, we show two two-dimensional slices where surface coexistence occurs in the blue region. The blue X in B corresponds to the location in the bulk phase diagram for which the surface phase diagram is plotted in C; moving this location would change the shape of the blue coexistence curve in C. The blue X in C is the location in the surface parameters for which the surface phase diagram is plotted in B. (D) Example phases observed in Monte Carlo simulations. (Top) Two examples without bulk coexistence, one with surface coexistence and one without. (Bottom) Two examples of coexisting bulk phases. A wet phase adheres to the membrane and a dry phase avoids the membrane.

