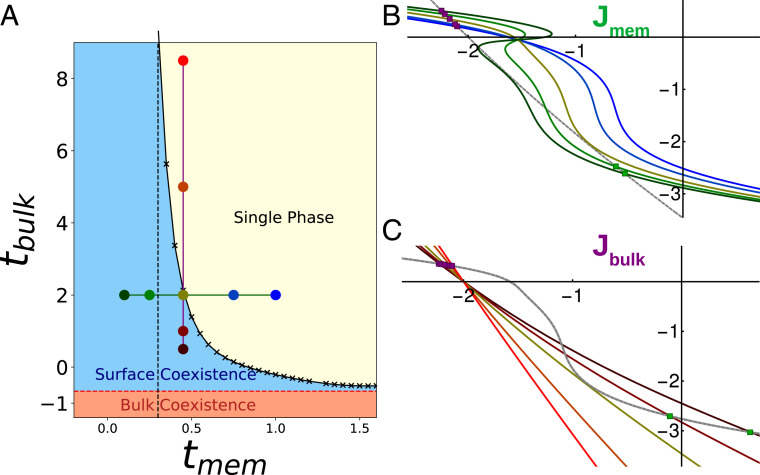
Fig. 6.
Critical point enhancement. (A) Phase diagram over and near the membrane critical point. The surface coexistence region (blue) extends to very weak near , marked by the dashed line. Outside of the coexistence region the surface is single phase (yellow). The bulk coexistence region (red) lies below the surface region. Here the surface would be presented as wet. (B) Gradient construction showing how the 2D curve changes on varying membrane coupling along the green line in A (colors from points in A). The slope of the surface curve increases as , diverging like the susceptibility near the membrane critical point. Polymer density profiles are plotted for each line. (C) Gradient construction varying along the purple line in A. Increasing decreases the slope of the bulk curve, promoting surface phase coexistence.

