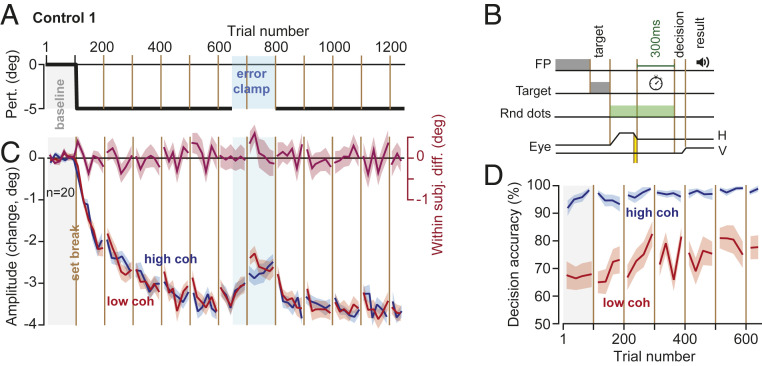
Fig. 4.
Control experiment: eliminating the error cost equalized rates of adaptation. (A and B) Design was similar to Exp. 1 to 3, with one crucial difference; the time available for viewing the random dot image did not start until the eye landed around the image. Thus, the subjects had 300 ms to view the random dots regardless of their primary saccade amplitude. (C) Primary saccade amplitude with respect to baseline. There were no significant within-subject differences in the rate or asymptote of adaptation. (D) Decision accuracy (and thus success rate) remained high for the high-coherence image. Bin size in C is 8 trials, in D is 12 trials. Error bars are SEM.

