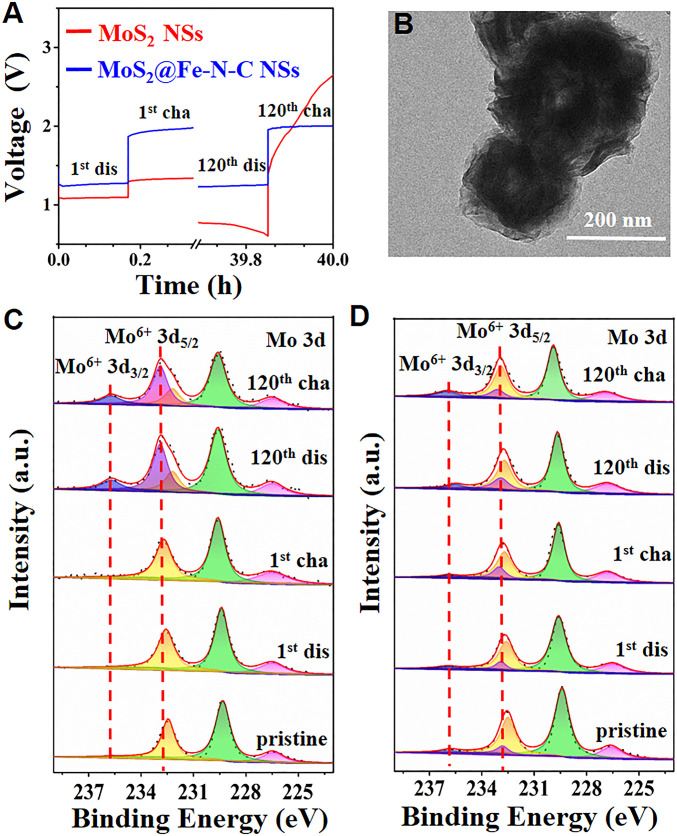
Fig. 4.
(A) The galvanostatic discharge and charge voltage profile of MoS2-based ZAB and MoS2@Fe-N-C-based ZAB at 5.0 mA⋅cm−2 during the 1st and 120th cycles, respectively. TEM image of (B) MoS2@Fe-N-C cathode after being cycled for 500 times. High-resolution XPS spectra of Mo 3d of (C) MoS2 cathode and (D) MoS2@Fe-N-C cathode obtained from the 1st discharge, 1st charge, 120th discharge, and 120th discharge processes.

