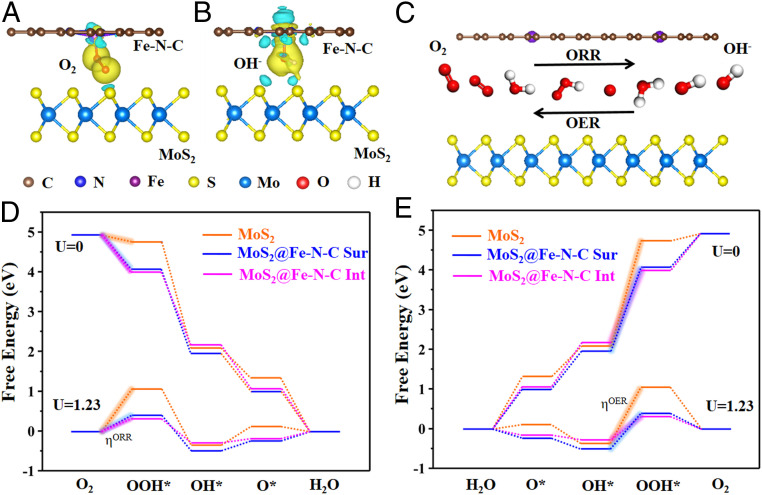
Fig. 5.
Electron density difference plots for MoS2@Fe-N-C with adsorbed (A) O2 and (B) OH−, respectively. The isosurface value of yellow and cyan regions are 0.003 Bohr−3. Yellow contours represent charge accumulations, and cyan contours denote charge depletion. (C) Schematic of O2 intercalation at the MoS2/Fe-N-C interface, and the production of OH− during the ORR process as well as its reverse process (OER process). Free energy diagrams of (D) ORR and (E) OER on MoS2, MoS2@Fe-N-C surface, and MoS2@Fe-N-C interface at U = 0 V and U = 1.23 V, respectively.

