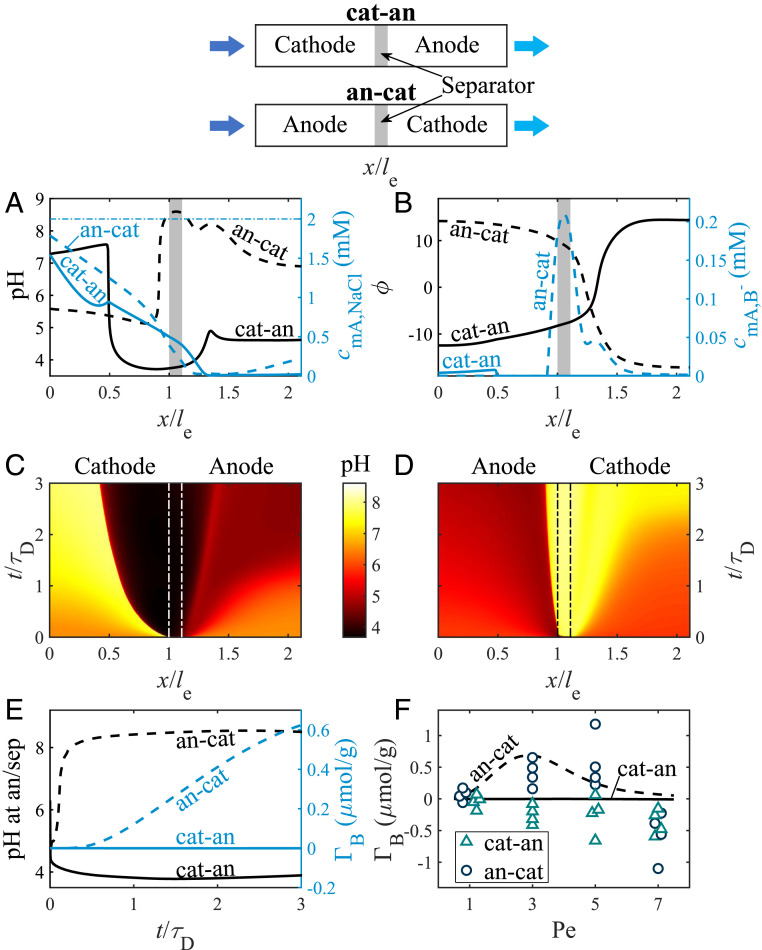
Fig. 2.
Predictions and experimental results for an FTE CDI cell with cathode placed upstream (cat-an; solid lines) or downstream (an-cat; dashed lines) for feed salt concentration, , of 2 mM; feed boron concentration, , of 0.37 mM; and charging voltage, , of 1.0 V, where in A–E, Pe = 3. (A) Predicted pH (left y axis, black lines) and macropore salt concentration (right y axis, blue lines) profiles in the FTE CDI cell. (B) Predicted dimensionless potential (left y axis, black lines) and macropore concentration (right y axis, blue lines) profiles. The profiles in A and B are snapshots at , the gray-shaded rectangles represent the separator, and the horizontal dash-dotted blue line in A represents the feed salt concentration. (C and D) pH in the macropores as a function of dimensionless location and time for cat-an configuration (C) and an-cat (D) configuration. The vertical dash-dotted lines in C and D represent the electrode/separator interfaces. (E) Predicted pH at the anode/separator interface (left y axis, black lines) and electrosorbed boron (right y axis, blue lines), both as a function of dimensionless time. (F) Predicted (lines) and measured (markers) boron electrosorption for an effluent collection time of 10 min as a function of Pe for cat-an (solid line, triangles) and an-cat (dashed line, circles) configurations. Schematics of the two configurations are presented at the top of the figure.

