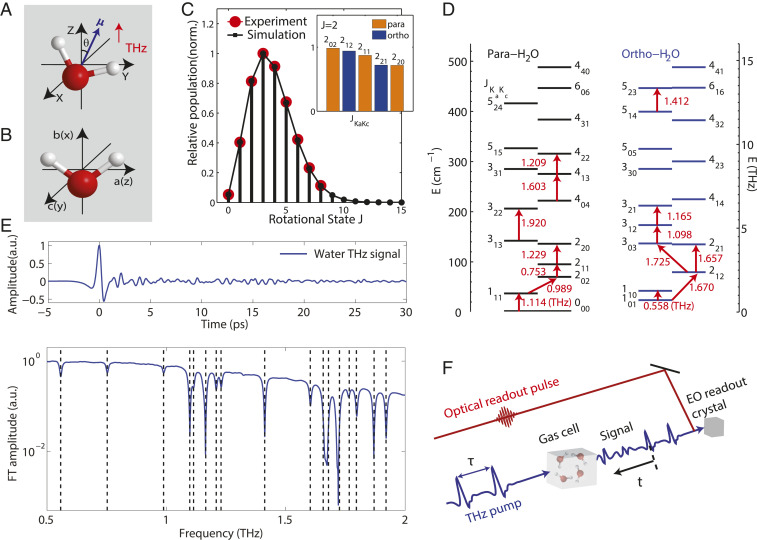
Fig. 1.
Overview of the experiment. (A) Water molecule in the laboratory frame, showing the dipole moment μ at an angle θ from the Z axis (THz polarization direction). (B) Water molecule in the molecule-fixed frame with the three moments of inertia Ia, Ib, and Ic along the corresponding axes. (C) Relative population distribution as a function of the J rotational quantum number. All relevant Ka and Kc components are included in the population distribution. (Inset) The relative population distribution within the state J = 2. (D) Rotational energy levels of para-H2O and ortho-H2O molecules. Red arrows illustrate rotational transitions and transition frequencies involved in this work. (E) Measured THz FID (Top) and Fourier transform (Bottom) showing rotational transitions (marked by dashed vertical lines) of water vapor in ambient air. (F) Schematic illustration of the 2D THz experimental setup. Linear THz spectra (example in E) are measured with only one THz pump pulse.

