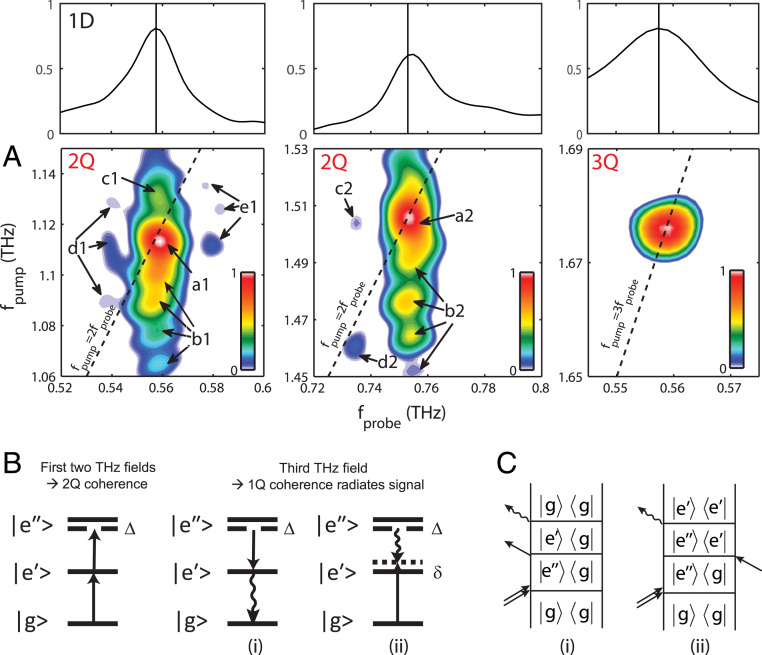
Fig. 4.
Many-body interactions in water vapor. (A) 2Q spectra near (Bottom Left) and (Bottom Middle) and 3Q spectrum at (Bottom Right) from water vapor at 60 °C. a1 and a2 are 2Q diagonal peaks. b1, c1, and b2 are 2Q off-diagonal features. d1, e1, c2, and d2 are side peaks that arise from distinct coherence pathways. Correspondences between peaks in the 1D spectrum and the 2Q peaks (indicated by vertical lines) are shown (Top). (B) Energy ladder diagram of water complexes with many-body interactions. The ground state , the singly excited state , and the doubly excited states are illustrated. Energy level shifts (denoted as Δ and δ; see also SI Appendix, Fig. S18) occur due to many-body interactions. Solid lines show the excited levels without interaction-induced shifts. The first two THz fields generate the 2Q coherence, which does not radiate. The third THz field may project |e″> downward (i) to the singly excited level |e′>, resulting in a coherence between |e′> and |g> that radiates at the usual 1Q transition frequency. Alternatively, the third THz field may promote from |g> to |e′>, resulting in a coherence between |e′> and |e″> whose frequency depends on the intermolecular geometry and whose shift from the usual 1Q transition frequency may be different from the 2Q frequency shift Δ. (C) Coherence pathways corresponding to the field interactions (i) and (ii) in B and to 2Q peaks which may show various spectral shifts along the pump (2Q) and probe (1Q) axes.

