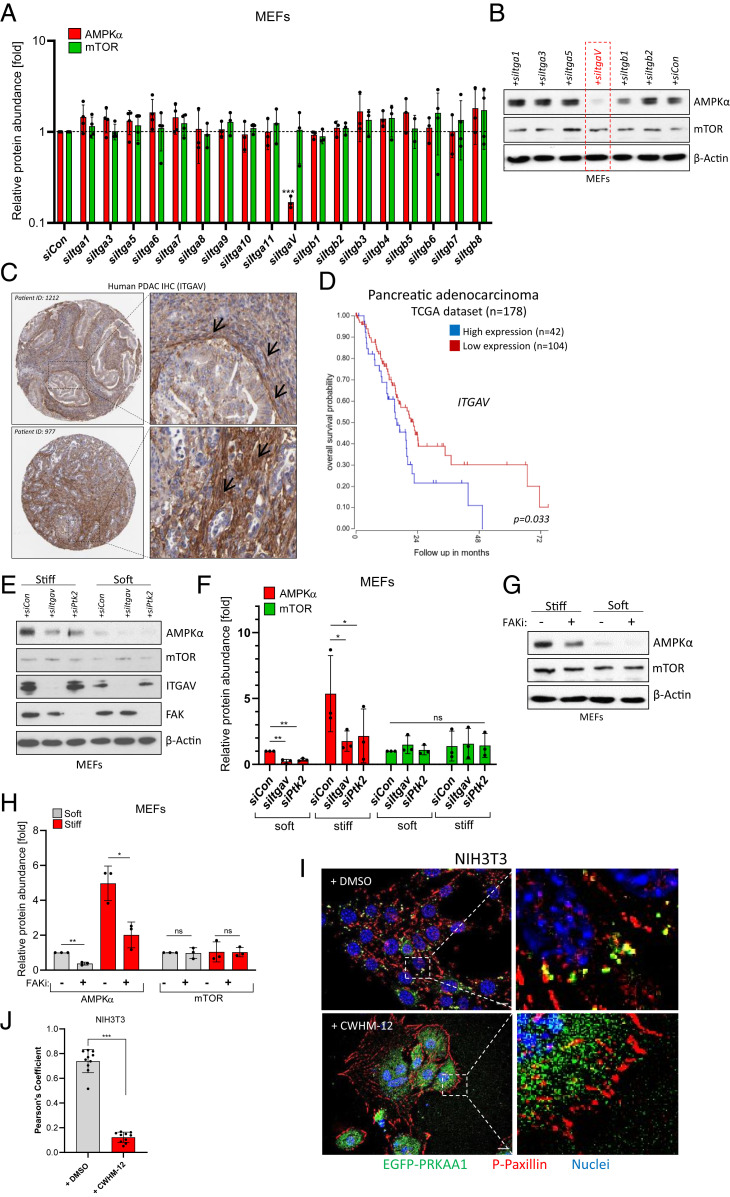
Fig. 2.
Integrin αV-FAK transmits stiffness information to AMPK. (A) Ribonucleic acid interference (RNAi) screen in MEFs cultured on plastic. Pools of four different siRNAs were transfected, and AMPKα or mTOR protein levels were subsequently determined by immunoblotting. Shown is an Actin-normalized quantification of n = 3 to 4 experiments (mean ± SD). Control siRNA = siCon. (B) Representative Western blot of MEF lysates after siRNA transfection on plastic dishes. (C) Immunohistochemical data (Human Protein Atlas) showing ITGAV protein expression in two PDAC patients. Black arrows denote ITGAV expression in stromal cells. (D) Kaplan–Meier curve (TCGA dataset) of PDAC patients depicting overall survival probability in relation to ITGAV gene expression (best cutoff by scan). (E) Levels of AMPKα, mTOR, ITGAV, and FAK in siRNA-transfected MEF cells cultured on soft/stiff substrates. (F) Quantification of n = 3 independent experiments as shown in E. Mean ± SD. Significance by paired one-tailed t test. (G) Levels of AMPKα and mTOR in soft/stiff-cultured MEF cells treated with the FAK inhibitor PF-573228 (FAKi, 10 µM, 16 h). (H) Quantification of n = 3 independent experiments as shown in G. Mean ± SD. (I) NIH 3T3 transiently expressing EGFP-AMPKα(PRKAA1) and stained for endogenous Phospho-Paxillin (P-PaxillinY118, red). Nuclei appear in blue. Images are three-dimensional (3D) deconvoluted images of cells cultured on glass slides. Cells were treated with DMSO or with CWHM-12 (500 nM, 24 h). (Scale bar, 10 µm.) (J) Pearson’s colocalization coefficient of EGFP-PRKAA1 and Phospho-Paxillin as depicted in I. Every data point represents the mean of two ROIs from one microscopic image.

