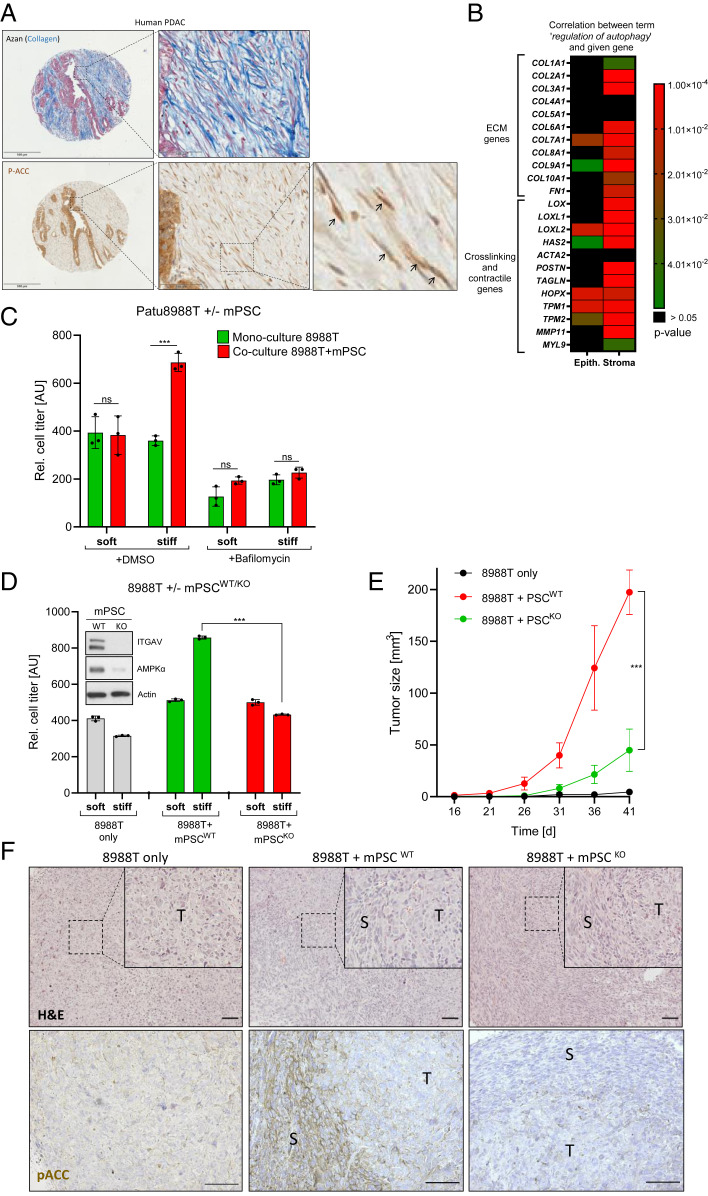
Fig. 4.
Stiffness-induced stromal autophagy provides paracrine growth support for cancer cells. (A, Upper) Visualization of collagen fibers by means of Azan staining (blue) in human PDAC. (Lower) Phospho-ACCS79 expression in human PDAC (brown). Black arrows depict phospho-ACCS79–positive stromal cells. (Left scale bar is 500 µm, Middle scale bar is 100 µm.) Serial sections were used for Azan staining and immunohistochemistry (IHC). (B) Heatmap depicting the correlation between the expression of indicated stromal genes and the gene set “regulation of autophagy.” The data set (25) comprises microdissected epithelial and stromal material from n = 66 human PDAC patients each. (C) Cell viability assay using luciferase-labeled human PDAC cells (PaTu8988T). Tumor cells were cultured on soft/stiff substrates either alone or in coculture with mPSCs for 4 d. The autophagy inhibitor Bafilomycin A1 (100 nM, 4 d) was used as a control to demonstrate autophagy dependence. Shown is one representative experiment (mean ± SD of triplicate measurements) of n = 4 independent experiments. (D) Cell viability assay as in C, but with mPSCs either WT or KO for ITGAV. Shown is one representative experiment (mean ± SD of triplicate measurements) of n = 3 independent experiments. Inset depicts protein levels of ITGAV and AMPKα in WT and KO mPSCs grown on plastic. (E) Subcutaneous xenograft growth in athymic nude mice. Animals received either 8988T cells alone (n = 7), in combination with WT mPSCs (n = 7) or in combination with KO mPSCs (n = 6). (F) Representative histology of resulting tumors from E. Upper panel depicts hematoxylin–eosin staining (H&E) while Lower panel depicts phospho-ACCS79 stainings. T = tumor region; S = stroma region. (Scale bar, 100 µm in both panels.)

