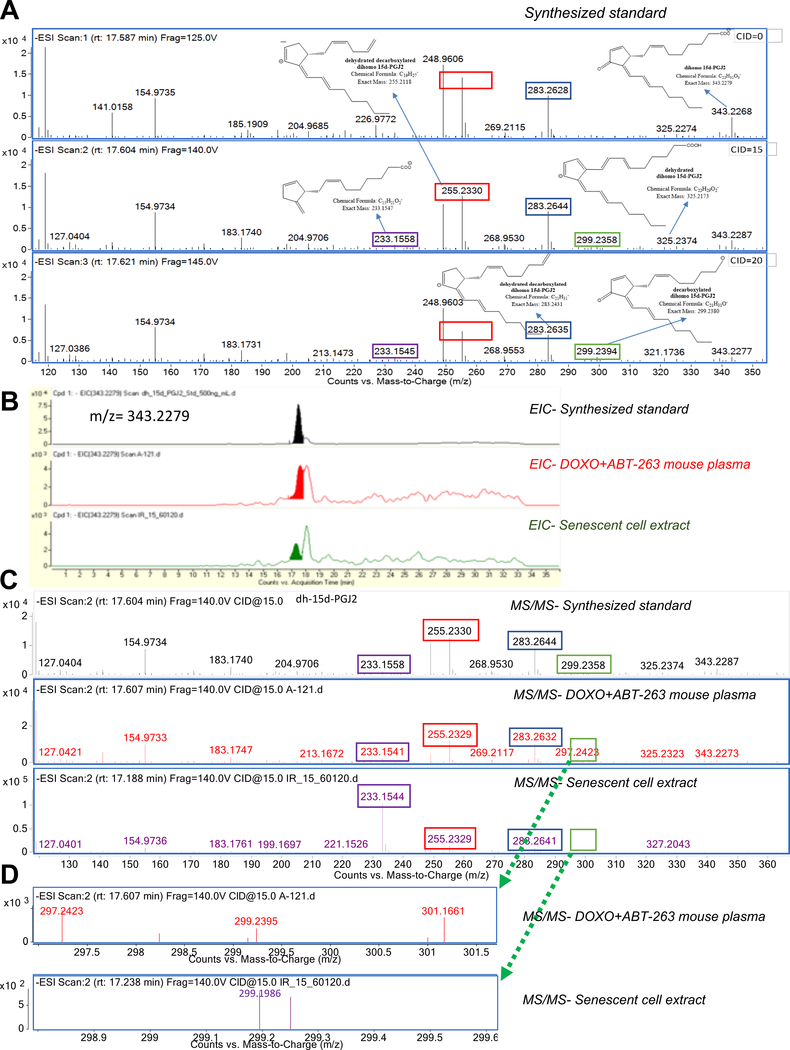
Figure 3. Validation of dihomo-15d-PGJ2 as a biomarker of senolysis.
A. A synthesized dihomo-15dPGJ2 standard was analyzed at 3 different voltages for fragmentation patterns. Key identification peaks included 299.2 m/z (C21H31O−: green box), 283.2 m/z (C21H31−: blue box), 255.2 (C19:H27−: red box), 233.2 (C15H21O2−: purple box). B. Extracted ion chromatograms from a dihomo-15d-PGJ2 standard (top), plasma from a DOXO+ABT-263 mouse (middle), and senescent cell extracts (bottom). Filled peaks appeared only in senolysis (middle) or senescence (bottom). C. Fragmentation patterns of filled peaks from B indicating a dihomo-15d-PGJ2 standard (top), plasma from a DOXO+ABT-263 mouse (middle), or senescent cell extracts (bottom). D. Zoomed chromatograms for the 299.2 m/z peak (zoomed area indicated by green boxes on Figure 3C) in DOXO + ABT-263 mouse plasma (upper) or senescent cell extracts (lower). Note that relative abundance of a non-specific peak (unfilled in Figure 3B) required earlier fragmentation in SEN(IR) extracts. See also Figure S3.

