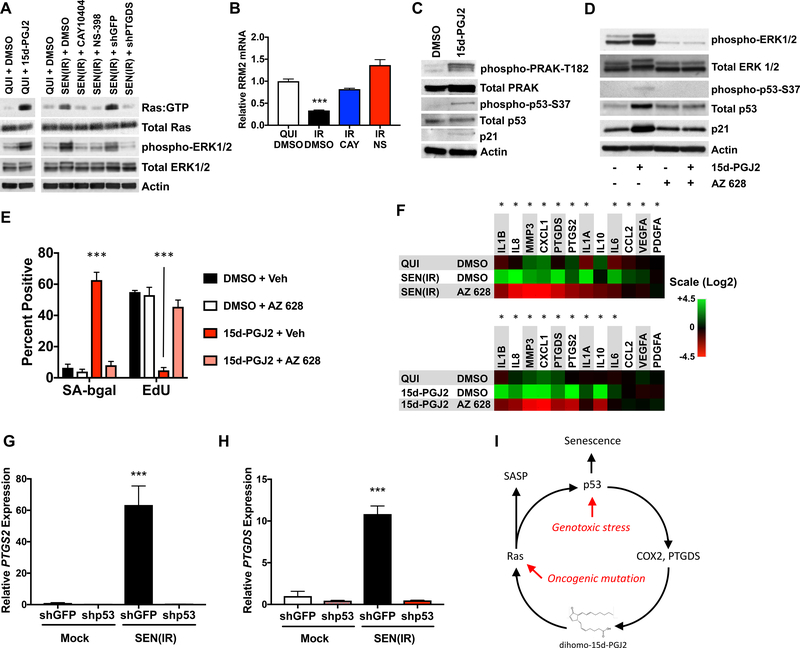
Figure 5. 15d-PGJ2 promotes senescent phenotypes by activating RAS.
A. Extracts from IMR-90 fibroblasts were analyzed for activated RAS (Ras:GTP), total Ras, phospho-ERK1/2, total ERK1/2, and actin by immunoblot. (Left) Quiescent cells were treated with DMSO or 5 μM 15d-PGJ2 for 15 minutes before harvest. (Right) Cells were induced to senesce by 10 Gy IR, and treated with DMSO, CAY-10404, NS-398, or lentiviral shRNAs to GFP (shGFP) or PTGDS (shPTGDS). Cells were cultured for 10 days prior to harvest, and in 0.2% FBS for the last 48 hours. B. Cells were induced to senesce by 5 Gy IR, and cultured in the presence of vehicle (DMSO), CAY or NS for 10 d. RNA was extracted, reverse-transcribed, and analyzed for RRM2 mRNA relative to actin mRNA by qPCR. C. Immunoblot of cells treated with DMSO or 10 μM 15d-PGJ2 for 10 days. Blots were probed for phospho-PRAK-T182, total PRAK, phospho-p53-S37, and total p53, p21 and actin. D. Cells were treated with vehicle or 15d-PGJ2, and DMSO or AZ 628 for 10 d. Protein was extracted and analyzed by immunoblot for phospho-ERK1/2, total ERK1/2, phospho-p53-S37, and total p53, p21 and actin. E. Cells treated as in D were analyzed for SA-Bgal or 24 h EdU incorporation. F. Cells were induced to senesce by 10 Gy IR or continuous culture with 10 μM 15d-PGJ2 for 10 days. DMSO or AZ 628 were concurrently added from Day 0 and present until day 10. Quiescent cells cultured in DMSO served as a control. RNA was then extracted and analyzed by qPCR for mRNAs encoding SASP factors, PTGS2 and PTGDS. G-H. Cells were transduced with lentiviral shRNAs to either GFP (shGFP) or p53 (shp53), mock irradiated or given 10 Gy IR and cultured for 10 days (shGFP) or 3 days (shp53) before RNA extraction and analysis for (G) PTGS2 or (H) PTGDS mRNAs. I. Model for a feedback loop involving 15d-PGJ2, RAS and p53 that reinforces senescent phenotypes. Chemiluminescent western images were captured with either film or by Bio-rad Gel-Doc. Image formats may therefore be inconsistent between lanes within panels. Bar graphs indicate averages of at least 3 experiments (*** = p<0.001, unpaired, 2-tailed t test). Heat maps indicate averages of 3 experiments (* = p<0.05, 2-way ANOVA). See Also Figure S5.

