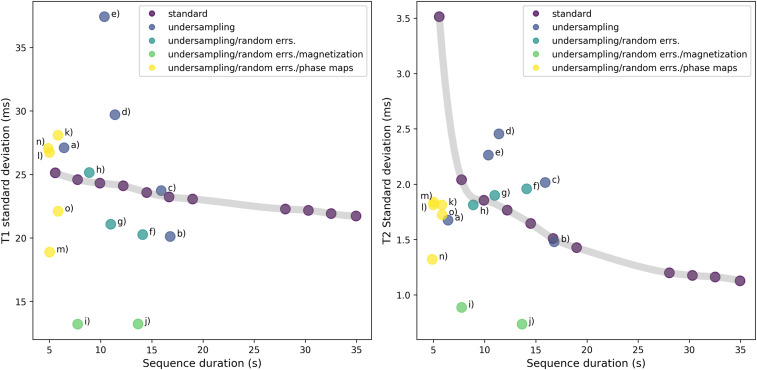
Fig. 5.
Precision vs. duration tradeoff in T1 (Left panel) and T2 (Right panel) for optimized and unoptimized sequences. Here, the metrics of precision are the SDs in inferred and values, which we estimate from in vivo data using bootstrap statistics, as described in ref. 41. The standard sequence from (1) is truncated to TR counts from 480 to 3,000 in order to obtain scans of different durations, as illustrated by the gray tradeoff curve. The optimized data points are classified according to which terms were included in the cost function. Unsurprisingly, the sequences with best robustness against random error (err.) are obtained by heavily incentivizing large signal magnitude (i.e., magnetization) in the cost function. In vivo images corresponding the labeled data points (a–o) are shown in SI Appendix. Note that these bootstrap statistics are derived from in vivo experimental data, for which exact ground truth values of and are inaccessible. Thus, they can only assess scatter, and not bias.

