Fig. 3.
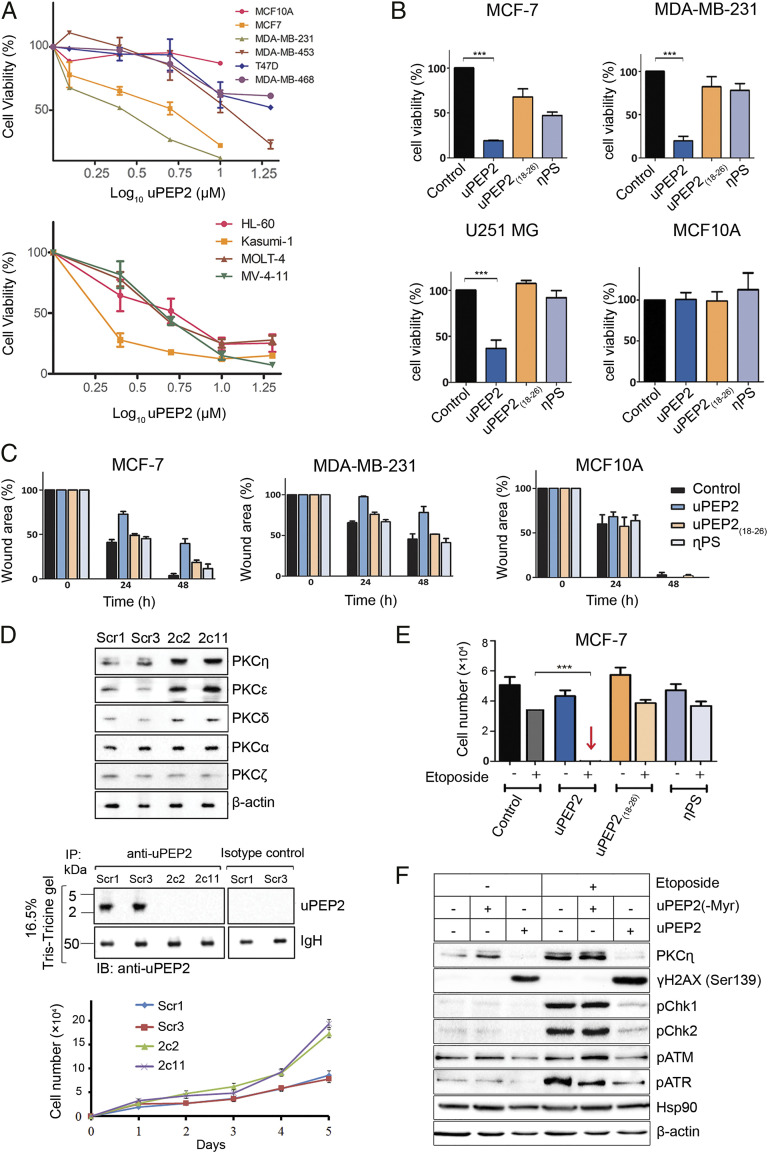
uORF2-encoded peptide inhibits cell proliferation and migration of cancer cells and is synergistic with chemotherapy by interfering with the response to DNA damage. (A) uPEP2 attenuates cell viability of breast cancer and leukemia-derived cells. Data shown represents three independent experiments carried with/without the presence of uPEP2 (1.25 to 10 μM). (B) uPEP2 reduces cell viability of MCF-7 and MDA-MB-231 breast cancer cells and U251 MG glioblastoma cancer cells but did not affect the viability of nontransformed MCF10A cells. uPEP2 was more effective compared to peptides containing the internal PS motif of PKC-η (η-PS) or lacking the PS-like sequence (uPEP2(18–26)). Data shown represents three independent experiments (peptide concentration, 10 μM). (C) uPEP2 inhibits migration of MDA-MB-231 and MCF-7 breast cancer cells but not of nontransformed MCF10A cells. Photographs were taken at indicated time points, and wound areas were normalized to time 0. Data shown represents at least three independent experiments (peptide concentration, 5 μM). uPEP2 is more potent in inhibiting migration compared to η-PS and uPEP2(18–26). All microscopy images appear in SI Appendix, Fig. S6. (D) Endogenous deletion of uORF2 in MCF-7 cells relieves suppression on novel PKCs expression. Using a CRISPR/Cas9 lentiviral system, uORF2 mutated (2c2 and 2c11) and control (Scr1 and Scr3) MCF-7 clones were generated. The elevation of novel PKC protein levels compared to scrambled controls were observed, while classical PKC-α and atypical PKC-ζ protein levels were unaffected. Immunoprecipitation experiments (as in Fig. 1D) verified the expression of uORF2-encoded peptide (uPEP2) in scrambled control (Scr1 and Scr3) clones but not in the deletion clones. Cell proliferation assay shows enhanced cell proliferation in uORF2-deleted MCF-7 clones. (E) uPEP2 is synergistic with etoposide in the induction of cell death. MCF-7 cells were treated with indicated peptides (2 μM) followed by the addition of etoposide (50 μM) for 48 h. Cell numbers were quantified by standard curves of absorbance versus cell numbers as described in Materials and Methods. Data shown are means of at least three separate experiments. (F) uPEP2 interferes with the cellular response to DNA damage. Experiments were carried out as in D followed by cell lysis (30 min after etoposide addition). A peptide without a myristoyl group at the N terminus of the peptide, unable to enter the cells, was used as a control. Phosphorylation on DNA damage response markers γ−H2AX, Chk1, Chk2, ATM, and ATR were detected using Western blot analysis and specific antibodies. Hsp90 and β-actin were used as markers for equal protein loading. The results shown are representative of three independent experiments. P values calculated using one-way ANOVA. ***P ≤ 0.001.

