Figure 3.
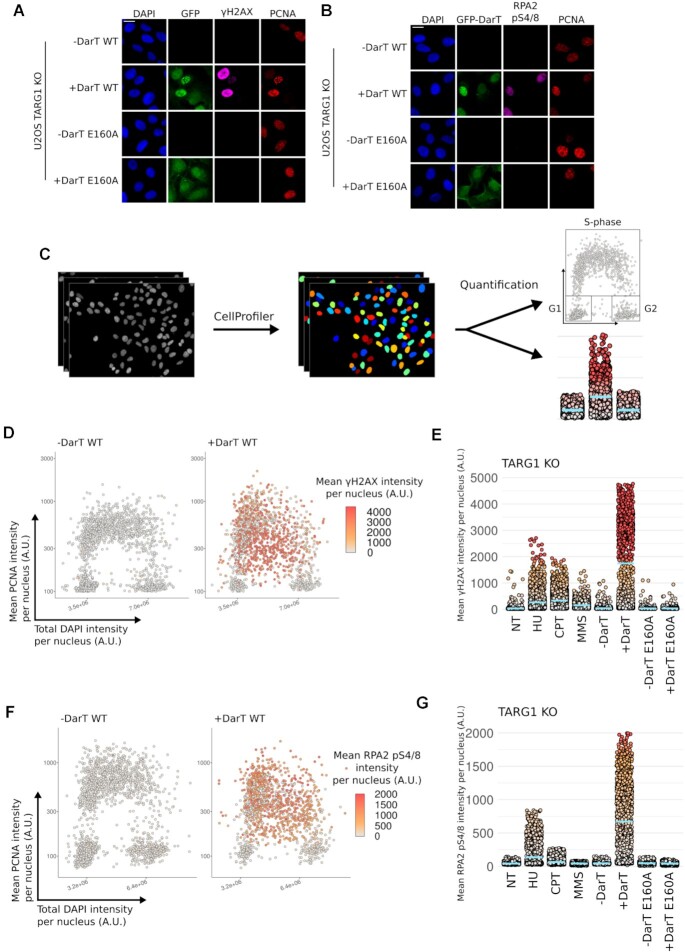
DarT induces the DDR at sites of DNA replication (A) Representative images of U-2 OS TARG1 KO cells expressing either GFP-DarT WT or E160A for 24 h were pre-extracted and immunostained for GFP, γH2AX and PCNA. Nuclear DNA was counterstained with DAPI. Scale bar 20 μm. (B) Representative images of U-2 OS TARG1 KO cells expressing either GFP-DarT WT or E160A for 24 h were pre-extracted and immunostained for GFP, RPA2 pS4/8 and PCNA. Nuclear DNA was counterstained with DAPI. Scale bar 20 μm. (C) Workflow for QIBC analysis. (D) QIBC analysis of asynchronous U-2 OS TARG1 KO cells expressing GFP-DarT WT for 24 h. Cells were pre-extracted, fixed and immunostained as in A. QIBC was used to record total DAPI intensity, mean PCNA intensity and mean γH2AX intensity per nucleus for >1000 cells. DAPI and PCNA intensities for individual cells were used to generate the scatter plot and γH2AX intensity was used to colour points. (E) QIBC analysis of γH2AX in TARG1 KO cells in response to the genotoxin treatments found in Figure 2B. Blue bar represents the mean γH2AX intensity for each population and each point represents the mean γH2AX intensity for an individual nuclei. (F) U-2 OS TARG1 KO cells were treated and analysed as in (D) and immunostained as in (B). (G) QIBC analysis as in E and immunostained as in (B).

