Figure 4.
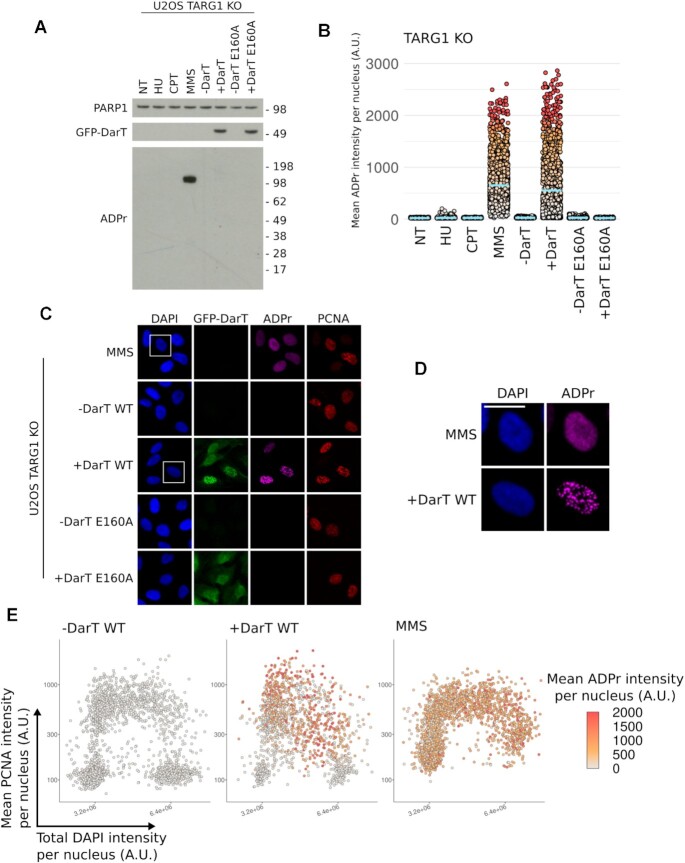
DarT induces ADP-ribose foci in S-phase cells with no ADP-ribosylation detectable by western blot. (A) U-2 OS TARG1 KO cells treated with HU (2 mM, 24 h), CPT (1 μM, 1 h), MMS (2 mM, 1 h), DarT (24 h), DarT E160A (24 h). Levels of ADP-ribosylation were assessed using the CST poly/mono ADP-ribose antibody in response to the aforementioned genotoxins. (B) QIBC analysis of ADP-ribosylation in TARG1 KO cells in response to the genotoxin treatments in A. Blue bar represents the mean ADP-ribosylation intensity for each population and each point represents the mean ADP-ribosylation intensity for an individual nuclei. (C) Representative images of U-2 OS TARG1 KO cells expressing either GFP-DarT WT or E160A for 24 h or cells treated with MMS (2 mM, 1 h) were pre-extracted and immunostained for GFP, ADP-ribosylation, PCNA and nuclear DNA was counterstained with DAPI. Scale bar 20 μm. (D) Magnified view of the region enclosed by the white square in (B) for DarT and MMS-treated cells. Scale bar 20 μM. (E) QIBC analysis of asynchronous U-2 OS TARG1 KO cells expressing GFP-DarT WT for 24 h or treated with MMS (2 mM, 1 h). Cells were pre-extracted, fixed and immunostained as in (C). QIBC was used to record total DAPI intensity, mean PCNA intensity and mean ADP-ribosylation intensity per nucleus for >1000 cells. DAPI and PCNA intensities for individual cells were used to generate the scatter plot and ADP-ribosylation intensity was used to color points.

