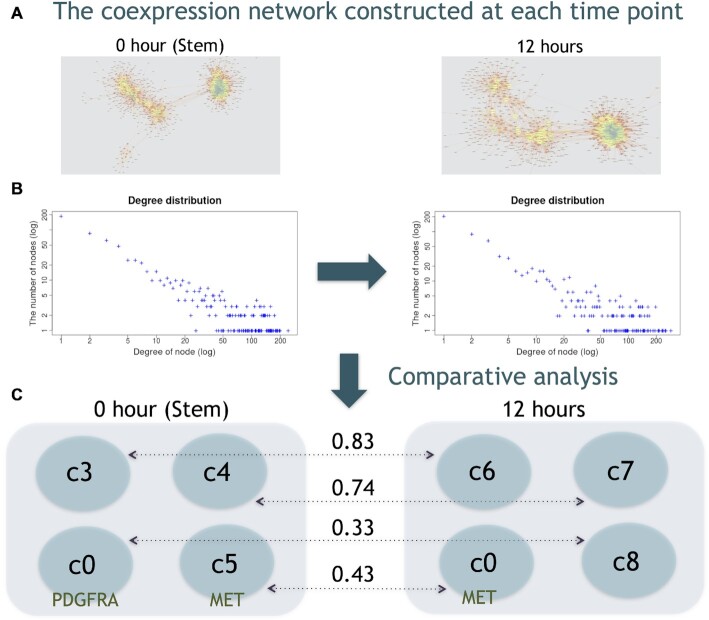
Figure 5.
Comparative analysis of coexpression networks at different time points. The coexpression network constructed at each time point (A) and degree distribution (B). The blue and yellow nodes represent the high- and low-degree nodes, respectively. After decomposition of the coexpression networks, four communities were extracted for each sample, and the values between the communities at 0 and 12 hours represent the Szymkiewicz-Simpson coefficients (C).

