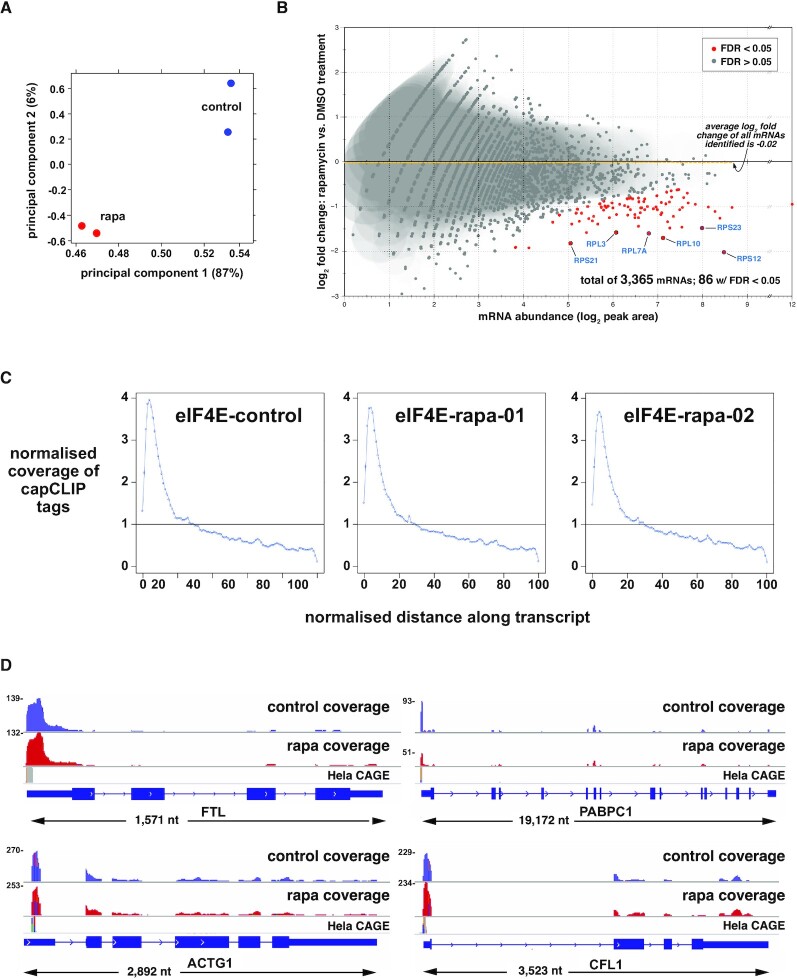
Figure 4.
capCLIP of rapamycin-treated and control HeLa cells. (A) PCA of the control and rapamycin sequencing datasets. (B) Log2 fold change in eIF4E affinity for 3365 individual mRNAs versus mRNA abundance (log2 of peak area). Eighty-six mRNAs show a statistically significant log2 fold change in eIF4E binding (P > 0.01; FDR > 0.05). Average log2 fold change in eIF4E binding of the total mRNA population is −0.02. (C) Distribution of capCLIP tags as a function of the normalized distance along the transcript for the single control (DMSO) replicate and two rapamycin (rapa) replicates. (D) IGV gene-level views, reformatted to aid visualization (all genes displayed 5′ to 3′, left to right). Displayed above each gene are histogram plots of control (in blue) and rapamycin (in red) capCLIP tag alignments, along with HeLa CAGE data (in grey). Numbers to the left of each tag histogram indicate raw tag counts at the highest point of each 5′-UTR tag peak.

