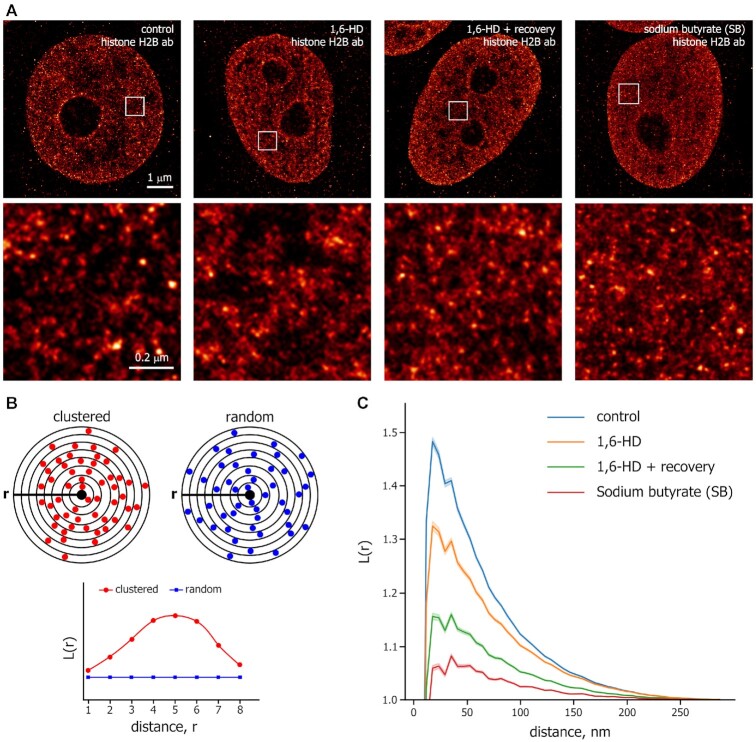
Figure 2.
Super-resolution microscopy analysis of chromatin organization changes induced by 1,6-HD. (A) Representative STORM images of H2B in human HeLa cells that had been permeabilized with Tween 20 and either untreated (control), treated with 1,6-HD (5%, 15 min), treated with 1,6-HD and then incubated in a drug-free medium for 1.5 h, and non-permeabilized cells treated with sodium butyrate (SB; 5 mM, 14 h). Scale bar: 1 μm. Magnified images from the boxed regions in the image of each nucleus are shown. Scale bar: 0.2 μm. (B) A simplified scheme for L-function analysis. The scheme shows clustered (red circles) or random (blue circles) particles around the origin point (black circle). L-function plots of clustered and random patterns are shown. (C) L-function plots of chromatin using the same conditions as described in (A). The shaded parts of the curves represent 95% confidence intervals (CIs). For each condition, n = 14–23 cells.

