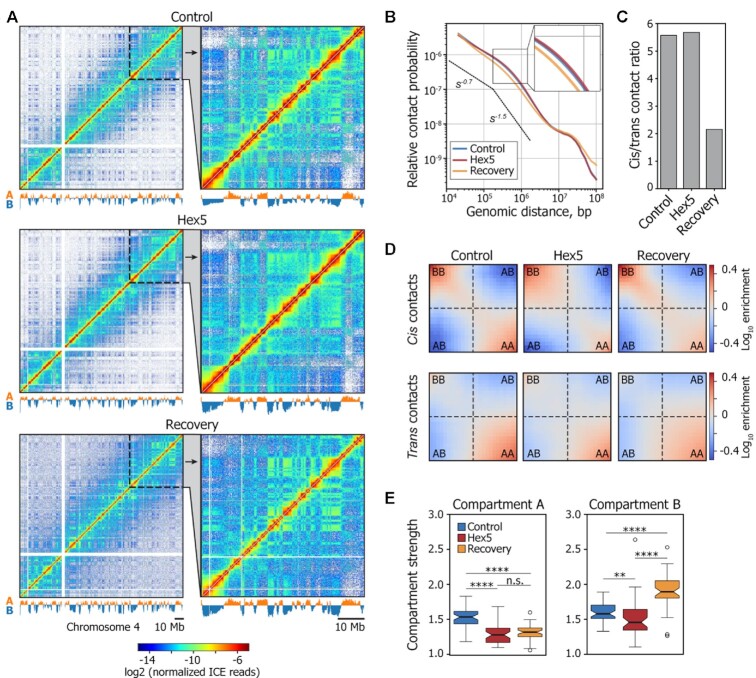
Figure 3.
1,6-HD treatment alters the strength of A and B compartments. (A) Visualization of Control, Hex5, and Recovery contact matrices at a 100-kb resolution. The compartment profiles are shown below the maps. (B) Dependence of contact probability, Pc(s), on genomic distance, s, for Control, Hex5, and Recovery samples. Black lines show the slopes for Pc(s) = s−0.75 and Pc(s) = s−1.5. A magnified view of a section of the graph is presented in the top-right corner of the picture. Note that the Control and Hex5 curves are almost completely merged. (C) Ratio between cis (intrachromosomal) and trans (interchromosomal) contacts in Control, Hex5 and Recovery contact matrices. (D) Heatmaps (saddle plots) showing log10 values of contact enrichments between genomic regions belonging to A and B compartments. (E) Compartment strength in cis in Control, Hex5, and Recovery contact matrices. ****P < 0.0001, **P < 0.01, n.s. – non-significant difference in a Mann–Whitney U-test.

