
Figure 4.
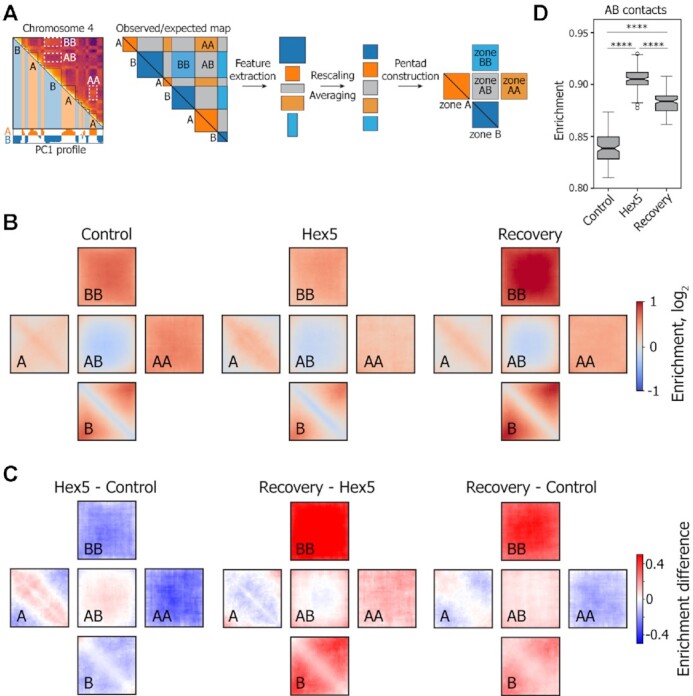
Pentad analysis of A and B compartments upon 1,6-HD treatment. (A) Schematic representation of the principal of pentad analysis. (B) Plots (pentads) showing the observed-over-expected contact frequencies inside the A and B compartments at short (A, B; compartmental domains) and large genomic distances (AA, BB) and between compartments (AB). (C) Pairwise subtractions of Control, Hex5, and Recovery pentads. (D) Boxplots showing the contact frequencies between the A and B compartments. ****P < 0.0001 in a Mann–Whitney U-test.