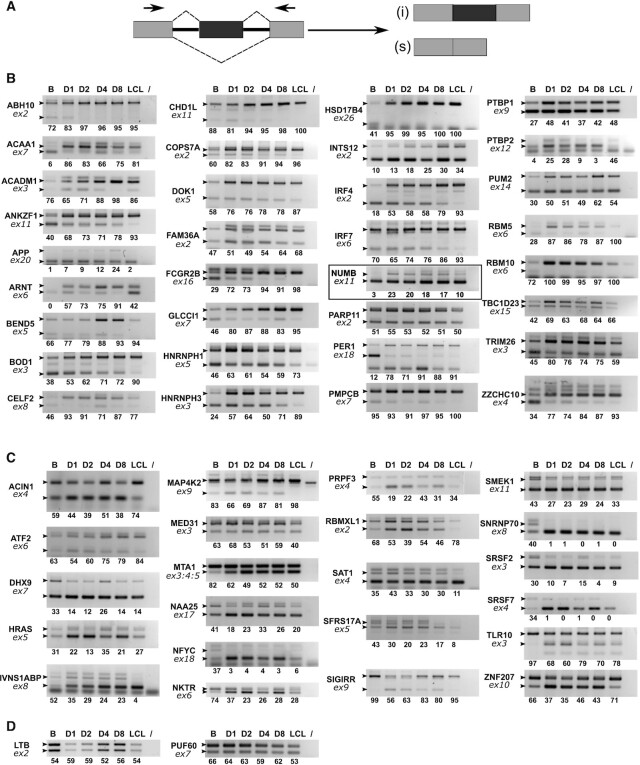
Figure 2.
RT-PCR validation of ASE events. (A) schematic representation of a typical ASE and primer positions for PCR amplification. (B and C) validation of ΔPSI positive and negative events respectively. Human primary B cells were infected with EBV and cells collected prior to infection (D0), at days 1, 2, 4 or 8 p.i. (D1, D2, D4 and D8 respectively) and after establishment of the LCL. RNA was analysed by semi-quantitative RT-PCR followed by agarose gel migration of the amplification products. Gene names are indicated on the left of each panel, together with the number of the concerned exon (ex: exon). Small black arrow heads indicate the expected migration location of each isoform as determined using the FasterDB database. The last lane of each panel (/) corresponds to a PCR amplification control performed in the absence of cDNA. The relative amounts indicated under each panel represent the percentage of inclusive isoform and were quantified using Image Lab software (Bio-Rad). The highlighted panel signals a splicing event that will be further studied as a putative target for EBNA2 and EBNA-LP regulation. (D) Examples of non-validated events.

