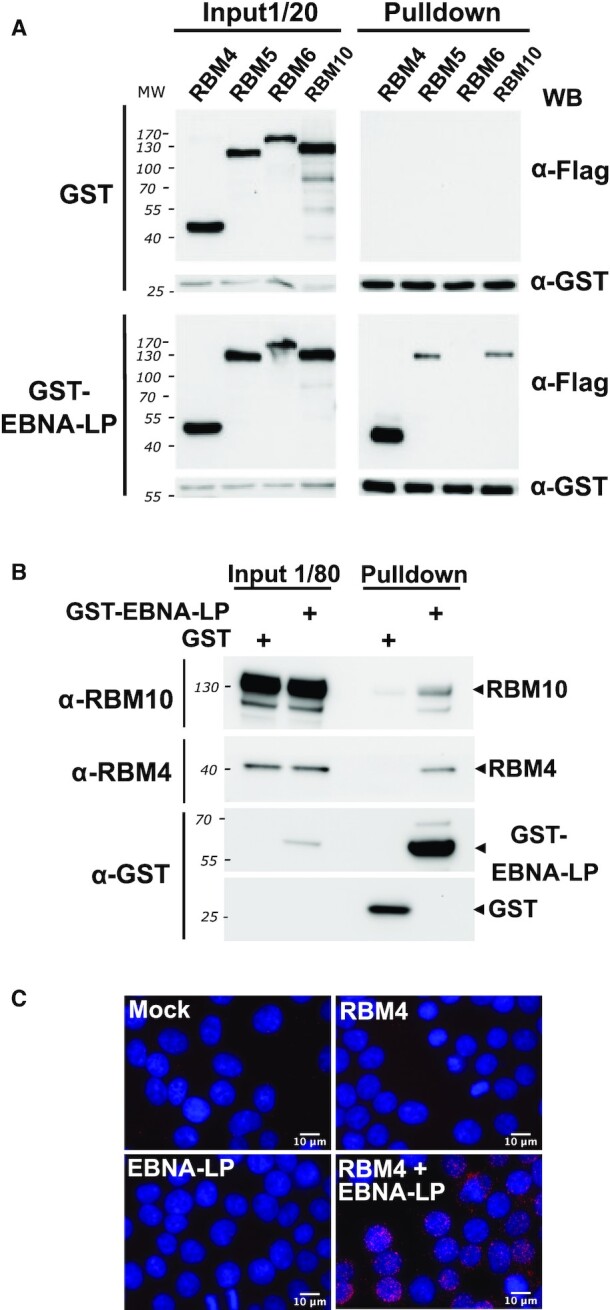
Figure 6.

EBNA-LP interacts with both the RBM4 protein and members of the RBM5, 6 and 10 family of proteins in HEK293T cells. (A) RBM4 and to a lesser extent RBM5 and RBM10 proteins co-pulldown with GST-tagged EBNA-LP. Flag-tagged RBM4, RBM5, RBM6 or RBM10 expression plasmids were transfected into HEK293T cells together with either GST or GST-EBNA-LP expression plasmids. Cellular extracts were incubated with glutathione sepharose-4B beads and the pulled-down complexes analysed by western blotting using an anti-Flag antibody to detect the RBM proteins or an anti-GST antibody to detect GST and GST-EBNA-LP fusion proteins. Left panels correspond to the analysis of 1/20 of cell extract used for each pulldown prior addition of the glutathione sepharose beads. Right panels correspond to the analysis of proteins complexes pulled-down with the GST or GST-EBNA-LP proteins as indicated. (B) GST-tagged EBNA-LP binds endogenous RBM4 and RBM10 proteins in pulldown experiments. GST or GST-EBNA-LP expression plasmids were transfected into HEK293T as indicated. After 24 h, cellular extracts were incubated with glutathione sepharose-4B beads and the pulled-down complexes were analyzed by western blotting using anti-RBM4 or anti-GST antibodies as indicated. The two left columns correspond to the analysis of 1/80 of cell extract used for each pulldown prior to the addition of the glutathione sepharose beads. The two right columns correspond to the analysis of proteins complexes pulled down with the GST or GST-EBNA-LP proteins as indicated. (C) In vivo cell co-localization of EBNA-LP and RBM4. A Proximity Ligation Assay (PLA) experiment to determine whether EBNA-LP interacts with RBM4 intracellularly was performed with HEK293T that were mock-transfected or co-transfected with either pCI-Flag-EBNA-LP, pDEST-myc-RBM4, or both as indicated in the panels. The interaction between EBNA-LP and RBM4 was analysed 24 h post-transfection using rabbit anti-Flag and mouse anti-myc antibodies. The pictures show a maximum intensity projection of the raw image based on 20 z-planes. Scale bar = 10 μm. The PLA signals are shown in red together with DAPI staining in blue.
