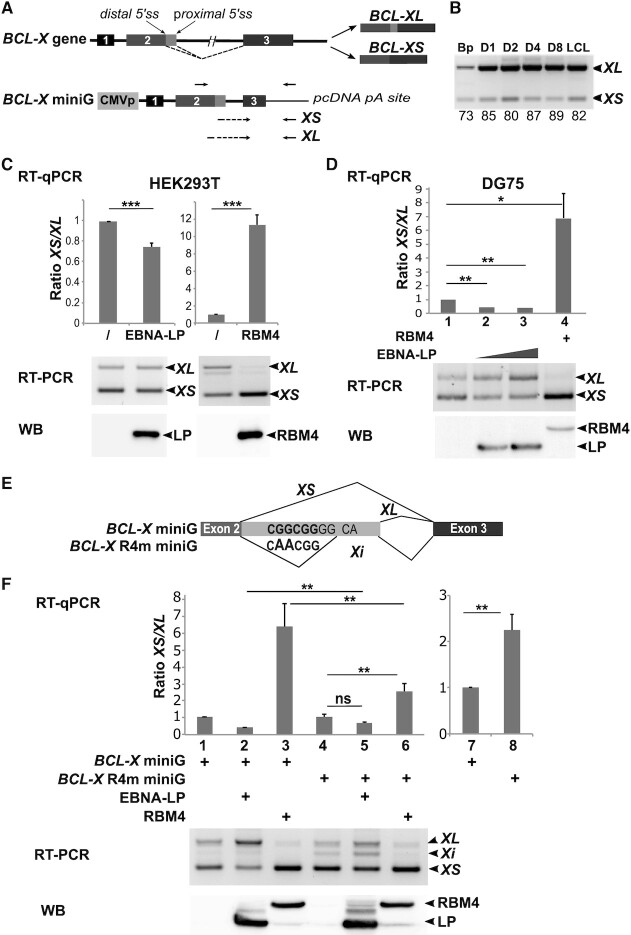
Figure 7.
EBNA-LP modulates BCL-X alternative 5′ splice site selection. (A) Schematic representation of the BCL-X gene and its two alternatively spliced isoforms BCL-XL and BCL-XS and below the BCL-X minigene (BCL-X miniG) reporter construct. Exons are represented by boxes and introns by lines. Distal and proximal 5′ splice sites in exon 2 are indicated. Arrows placed above the BCL-X miniG schematic representation indicate the location of primers used for semi-quantitative RT-PCR. Arrows placed below indicate the location of primers used for quantitative RT-PCR to amplify either the XL or XS isoforms. (B) RT-PCR analysis of the respective XL and XS levels in primary B cells and EBV-infected B cells. The same RNAs as previously used to validate specific ASE events in Figure 2, served to amplify the BCL-X isoforms by semi-quantitative RT-PCR. PCR amplified fragments were separated on a 2.5% agarose gel. The relative amounts indicated under the panel correspond to the percentage of inclusive isoform and were quantified using Image Lab software (Bio-Rad). (C) EBNA-LP favors selection of the proximal 5′ splice site of the BCL-X miniG RNA in epithelial cells. HEK293T cells were transfected with the BCL-X miniG construct alone or together with an EBNA-LP or an RBM4 expression plasmid. Upper panel: the ratio between the XS and XL isoforms was analysed by quantitative RT-PCR; the data are presented as two different panels in order to better visualize the impact of EBNA-LP and RBM4 respectively on the XS/XL ratio compared to that obtained with the BCL-X miniG construct alone. Middle panel: semi-quantitative RT-PCR analysis of XS/XL levels of one representative experiment. Lower panel: western blot analysis of protein levels of one representative experiment. (D) EBNA-LP favours selection of the proximal 5′ splice site of the BCL-X miniG RNA in B cells. DG75 cells were transfected with the BCL-X miniG reporter construct, together with RBM4 and EBNA-LP expression plasmids as indicated. Upper, middle and lower panels are as described in C. (E) Schematic representation of the BCL-X R4m miniG mutant construct and the various RNA isoforms produced. The RBM4 binding site nucleotide sequence is indicated in bold letters. Below, the mutated RBM4 binding site nucleotide sequence is indicated with the 2 nucleotides that has been changed in larger letters. XS, XL and Xi RNA isoforms are represented with the thin lines indicating spliced area. (F) Mutation of an RBM4 binding site motif in the BCL-X miniG compromises the capacity of both EBNA-LP and RBM4 to regulate alternative splicing of BCL-X RNA. DG75 cells were transfected with mutant BCL-X R4m or wild-type BCL-X miniG constructs, together with RBM4 and EBNA-LP expression plasmids as indicated. Upper, middle and lower panels are as described in C. Left histogram (lanes 1–6): the data were normalized for each reporter. Right histogram (lanes 7 and 8) : has been generated with the same data as those used for lanes 1 and 4 of left histogram but without normalization. Error bars represent the standard deviations from a minimum of three independent experiments. The P-values of paired Student's t-test are indicated by the asterisks above the graphs (***P< 0.001; **P< 0.05; * P < 0.1; ns, not significant).

