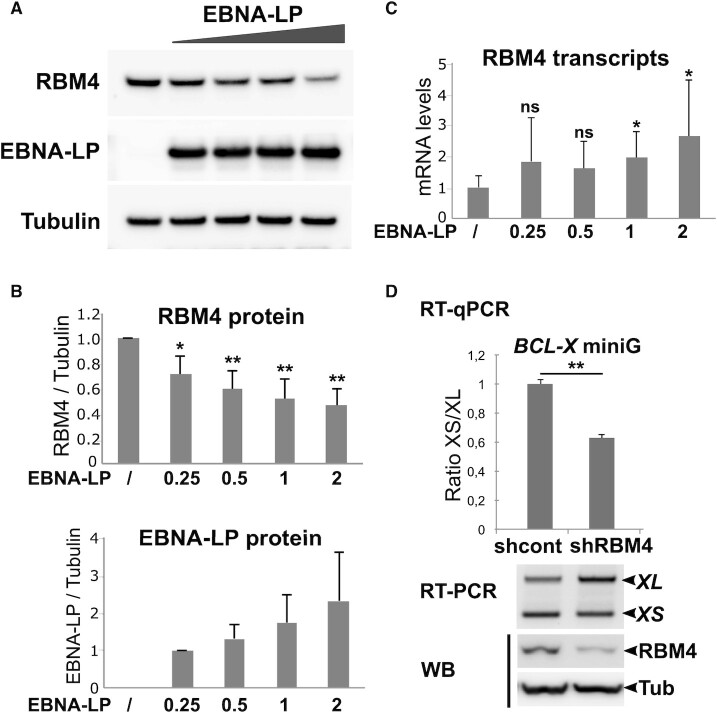
Figure 8.
EBNA-LP expression induces a dose-dependent decrease in endogenous RBM4 protein. (A) HEK293T cells were transfected with increasing amounts (0.25, 0.5, 1 or 2 μg) of EBNA-LP expression plasmid for 48 h and whole cell lysates were analysed by western blot using specific antibodies against RBM4, EBNA-LP or tubulin as indicated. Using JetPEI (Polyplus transfection) as a transfecting reagent, we reach 70 to 80% of transfected cells as deduced from control transfection with a GFP expression plasmid. (B) Western blots obtained as indicated in panel A were quantified using Image Lab software (BioRad) with tubulin as an internal reference. Mean values from 5 independent experiments (n = 5) are shown with standard deviation. Significant P-values are indicated by asterisks above the graphs (***P< 0.001; **P< 0.05; * P < 0.1; ns, not significant). (C) RNA from the same cell lysates were analysed by RT-qPCR using primers specific for the RBM4 transcripts. Reported values were normalised with respects to GAPDH. (D) A knockdown of RBM4 using a specific shRNA leads to an increase in the use of the proximal 5′ splice site of the BCL-X miniG RNA. HEK293T cells were transfected with an RBM4 shRNA expression plasmid or a control shRNA plasmid for 24 h. The cells were subsequently transfected with the BCL-X miniG construct together with the RBM4 or control shRNA plasmids respectively for 48 h. Upper panel: the ratio between the XS and XL isoforms was analysed by quantitative RT-qPCR. Mean values of 3 replicates are shown with standard deviation. P-value is indicated by the asterisks above the graph (**P< 0.05); Middle panel: gel agarose analysis of a semi-quantitative RT-PCR of a representative single experiment. Lower panel: western blot analysis of tubulin and RBM4 protein levels in a representative experiment.

