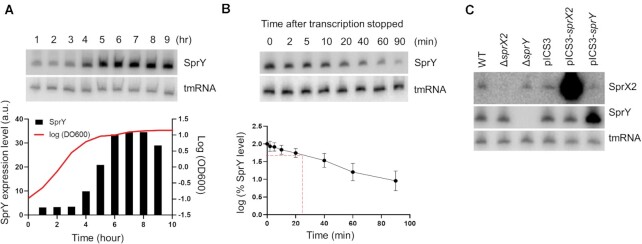
Figure 2.
SprY expression in HG003 strain. Expression of sprY was determined by northern blot analysis using labeled DNA probes for SprY. As loading controls, the blots were also probed for tmRNA. (A) SprY expression profile during a 24 h growth of Staphylococcus aureus HG003 strain (WT). The growth curve of WT strain is presented by line, with the quantification of SprY expression level relative to the amount of tmRNA from the same RNA extraction in black chart (a.u., arbitrary units). (B) Stability of SprY. HG003 (WT) was grown until 6 h (t = 0) and the RNA extraction was performed at 2, 5, 10, 20, 40, 60 and 90 min after adding Rifampicin. The quantification of SprY stability, in semi-log plot, was performed by ImageQuant Tools 7.0. The data represent the mean of three different experiments ± standard error. The maximum value of rnaIII expression at time 0 is normalized to 100% and the time at which the sRNA reaches 50% of its original level is indicated with red dotted line. (C) The expression of sprX2 and sprY at 6 h of bacterial growth of HG003 wild-type strain (WT), strains deleted for sprX2 or sprY (ΔsprX2; ΔsprY) and HG003 overexpressing sprX2 or sprY (pICS3-sprX2, pICS3-sprY) by northern blots, using labeled DNA probes for SprY and SprX2. As loading control, the blots were also probing for tmRNA.

