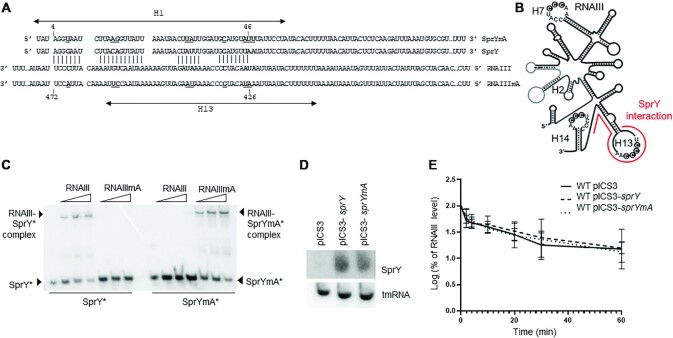
Figure 3.
SprY interacts with RNAIII. (A) Interaction between SprY and RNAIII was predicted by IntaRNA software (47). Mutant of SprY and compensatory mutant RNAIII were constructed (SprYmA and RNAIIImA). The nucleotides underlined and bolded correspond to the mutations in the sprY and rnaIII sequences. (B) Schematic presentation of RNAIII secondary structure and the region of RNAIII that interacts with SprY (shown by line). (C) Complex formations between SprY, SprYmA with RNAIII and RNAIIImA were analysed by native gel retardation assays. Shift assays of purified labeled SprY and SprYmA (SprY* and SprYmA*) were performed with increasing concentrations of RNAIII and RNAIIImA (0.25, 0.5 and 1.25 μM). (D) Verification of sprY expression in HG003 strain containing empty plasmid (pICS3) or over-expressing sprY (pICS3-sprY) or muted sprY (pCIS3-sprYmA) by northern blot using labeled DNA probes for SprY and tmRNA as control. (E) RNAIII stability was studied by northern blot using RNA total extraction in HG003 pICS3, HG003 pCIS3-sprY and HG003 pCIS3-sprYmA, at exponential growth phase (OD = 0.8). Time (min) corresponds to the time after adding Rifampicin. The RNAIII expression levels of in each sample were is normalized with the control gene (tmRNA). The data represent the mean of three different experiments ± standard error for RNAIII stability. The maximum value of rnaIII expression at time 0 is normalized to 100% and the time at which the sRNA reaches 50% of its original level is indicated with dotted line. All statistical analyses were performed using two-way ANOVA test and Bonferroni comparison test.

