Figure 4.
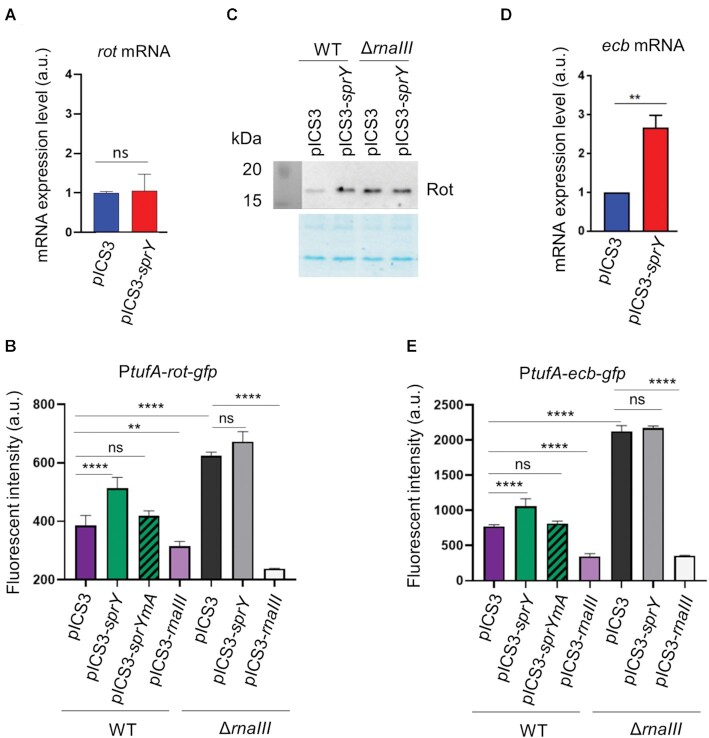
SprY affects the expression of RNAIII targets. Analysis of rot (A) and ecb (D) transcript levels in HG003 strain containing empty plasmid (pICS3) or overexpressing sprY (pICS3-sprY) by qPCR, using RNA extraction of those strains at early exponential growth phase. The mRNA expression level of rot and ecb in qPCR is normalized with the control gene (gyrB) and is calculated with 2−ΔΔCt relative quantification. (C) Analysis of Rot protein level in HG003 strains (WT and ΔrnaIII) containing empty plasmid (pICS3) or over-expressing sprY (pICS3-sprY) by western blot using polyclonal antibodies against Rot. The translational initiation level of rot (B) and ecb (E) under SprY regulation were studied by using gfp gene reporter. Staphylococcus aureus strains (WT and ΔrnaIII) containing the pCN33-PtufA-rot-gfp or pCN33-PtufA-ecb-gfp fusion plasmids co–transformed with pICS3, pICS3-sprY, pICS3-sprYmA or pICS3-PamiA-rnaIII. The fluorescent intensity was measured every 10 min over 20 h in a Biotek microplate reader. Bacteria growth in different HG003 strains and GFP fluorescence intensity are shown respectively in the left panel at OD 600 and in right panel quantified by Biotek. All statistical analyses were performed using Student’s t test. The error bars correspond to the average values from three independent experiments. Statistical significance is indicated by bars and asterisks as follows: **, P < 0.01; ***, P < 0.005; ****, P < 0.001.

