Figure 5.
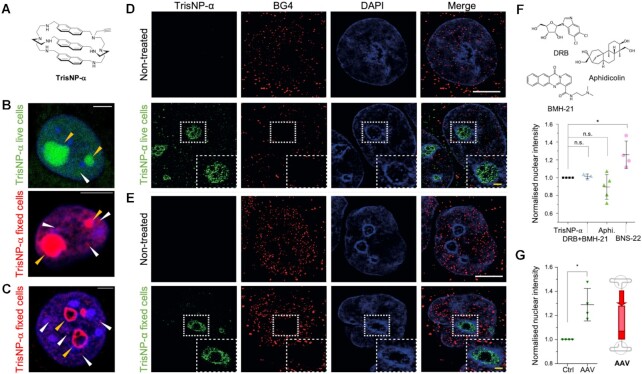
(A) Structure of TrisNP-α. (B,C) In situ click imaging obtained with TrisNP-α (3 μM, 4 h) incubated in live or fixed cells, then illuminated with Alexa Fluor 488-azide (green, live cell incubation) or Alexa Fluor 594-azide (red, post-fixation incubation). Ligand is present in the nucleoli (yellow arrows) and the nucleoplasm (white arrows). Cells pre-extracted (C) with CSK + RNAse show perinucleolar staining (yellow arrows). Nuclei are counterstained with DAPI (blue). Scale bars = 5 μm. (D, E) Super-resolution images of MCF7 cells are treated with TrisNP-α (3 h, 3 μM), pre-extracted with CSK + RNase A, fixed, clicked, and co-stained with BG4 antibody (D) or pre-extracted with CSK + RNase A, fixed, incubated with TrisNP-α (3 h, 10 μM), clicked and co-stained with BG4 antibody (E). Nuclei are counterstained with DAPI. White scale bar = 5 μm, yellow scale bar = 1 μm. (F) Change in nuclear intensity of live TrisNP-α click staining after pre-treatment with inhibitors DRB + BMH-21 (100/1 μM), aphidicolin (10 μM) and BNS-22 (50 μM). (G) TrisNP-α nuclear intensity increases with AAV1-mCherry treatment, stained as previously described and labelled after fixation via click reactions with AF488-azide. Nuclear intensity after inhibitor or AAV treatment was quantified in FIJI ImageJ and normalised to TrisNP-α staining. P values were calculated using a paired, two-tailed t test. ns: P> 0.05; *P< 0.05 (F, G).

