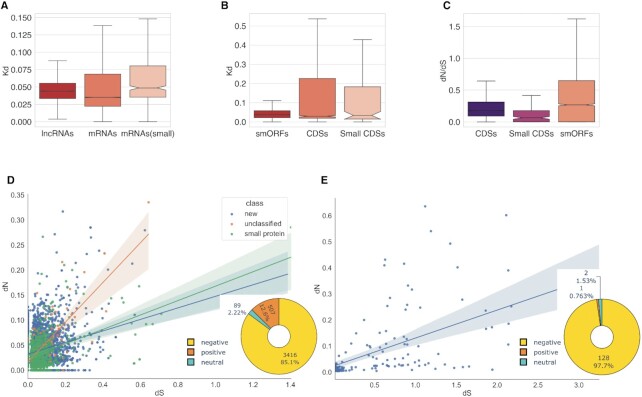
Figure 3.
Evolutionary rates and selection regimes in lncRNAs, mRNAs, smORFs and protein-coding genes. (A) The evolutionary rates distribution in pairwise alignments of P. patens and Physcomitrium sp. lncRNA (n = 4078) and mRNA transcripts (n = 15 926 and n = 252 for mRNAs encoded proteins above and below 100aa, respectively); P < 10–15 by Kruskal–Wallis rank sum test. (B) The evolutionary rates distribution in pairwise alignments of P. patens and Physcomitrium sp. smORFs and protein CDSs; P = 0.2 by Kruskal–Wallis rank sum test. (C) The distribution of dN/dS ratios in smORFs (n = 4022) and functional proteins (n = 8203). Small CDSs are protein smaller than 100aa; P < 0.0001 by Kruskal–Wallis rank sum test. (D) The distribution of dN versus dS values from smORF tblastn alignments; pie chart shows the number of smORFs classified based on dN/dS values. (E) The distribution of dN versus dS values from small CDSs (proteins below 100aa) tblastn alignments; pie chart shows distribution of dN/dS values.

