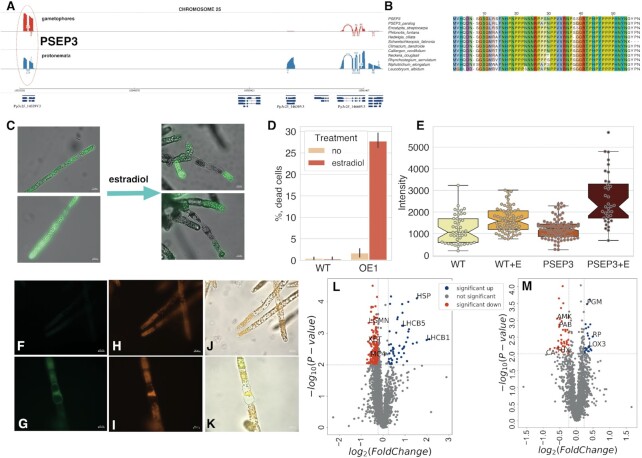
Figure 7.
Functional analysis of PSEP3 microprotein. (A) Sashimi plot showing nanopore-based transcription of PSEP3 and surrounding region on chromosome 25. (B) The multiple pairwise alignment of selected orthologs and translatable ‘new’ smORFs - PSEP3 and paralog XR_002972902.1_ORF5. (C) the influence of PSEP3 overexpression on cell viability measured by fluorescein diacetate (FDA) dye. The PSEP3 expression was induced by estradiol treatment in liquid culture; (D) The induction of cell death under estradiol treatment; WT - wild-type plants, OE1 - PSEP3 OE line. (E) Boxplot showing the difference in the intensity of DCFH-DA in PSEP3 OE mutant without/under estradiol treatment, respectively (P < 0.001 by two-way ANOVA followed by Tukey's multiple comparison test). (F, G) detection of ROS generation by DCFH-DA in PSEP3 OE mutant without/under estradiol treatment, respectively; (H, I) autofluorescence of chloroplasts without/under estradiol treatment, respectively. (J) the merged image of (F) and (H) pictures. (K) the merged image of (G) and (I) pictures. (L) Volcano plot of the entire set of proteins quantified during iTRAQ analysis in PSEP3 OE line. (M) Volcano plot of the entire set of proteins quantified during iTRAQ analysis in PSEP3 KO line. Proteins significantly changed in abundance are depicted in colour. Blue dots indicate up-regulated proteins and red dots indicate down-regulated proteins in PSEP3 mutants.

