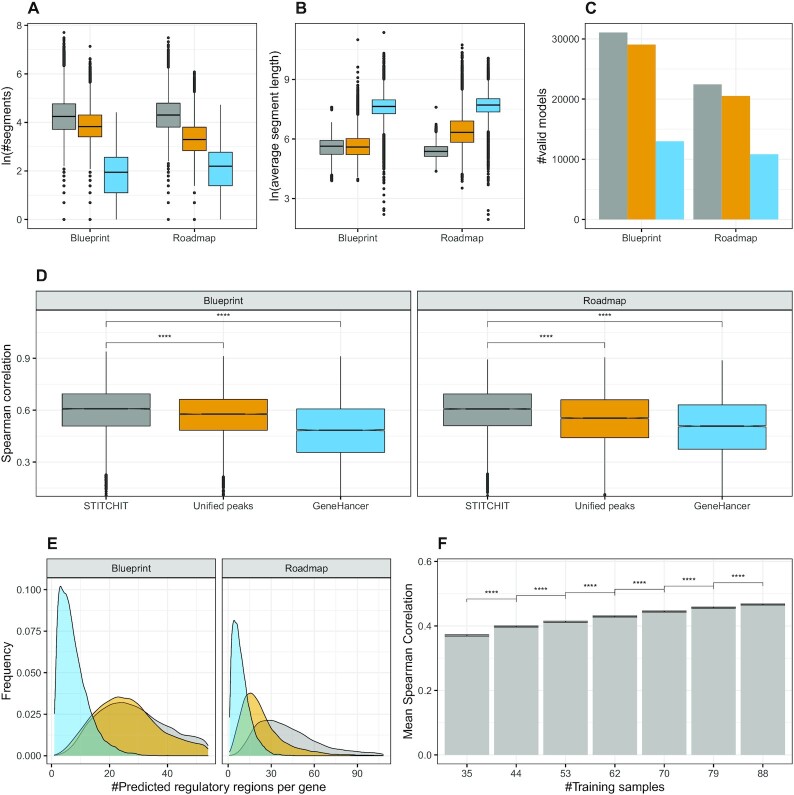
Figure 2.
(A) The natural logarithm of the number of segments selected by StitchIt, UnifiedPeaks, and GeneHancer is shown for each dataset respectively, whereas in (B), the average length of the selected segments is depicted. (C) The number of learned models is shown, separately per consortia and method. (D) Boxplots showing Spearman correlation between predicted and measured gene-expression using linear regression with elastic net penalty considering all regions identified by StitchIt, the UnifiedPeaks approach, GeneHancer, and individual peak aggregation respectively for Blueprint and Roadmap data. Within StitchIt, UnifiedPeaks, and GeneHancer Spearman correlation was used for the initial filtering of candidate regions. Within each consortia, the same set of genes is displayed to allow comparability (Blueprint: 11140, Roadmap: 9102). As indicated by a two-sided t-test, StitchIt regions achieve the best model performance (****P ≤ 0.0001). The estimated values for the variances are: 0.018, 0.017, 0.029 (Blueprint), 0.018, 0.024, 0.032 (Roadmap), for StitchIt, UnifiedPeaks and GeneHancer, respectively. (E) The density plots delineates the number of predicted REMs per gene, shown separately for the used datasets and tested methods. Note that, due to the design of the linear model, the maximum number of predicted REMs is capped by the number of samples used for model training. (F) Considering  of the entire Roadmap data set, we performed down-sampling experiments training 10 models for each gene with a different number of training samples, evaluated on the remaining
  of the data. According to a two-sided t-test (****P ≤ 0.0001), the performance drop is significant for each reduction of training samples.

