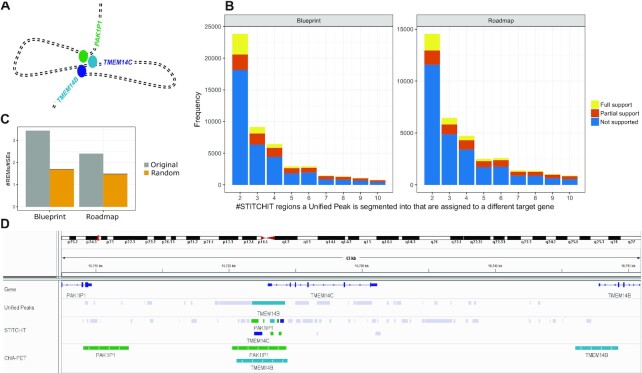
Figure 5.
(A) Schematic illustration of chromatin folding: Three genes, namely TMEM14B, TMEM14C and PAK1P1 are brought to close spatial proximity via loop formation thereby establishing regulatory interactions between the genes and their enhancer elements (colored bubbles) that together form a cluster of enhancers that is in close genomic proximity to TMEM14C. (B) The bar plots indicate on the x-axis the magnitude of a Split event, that is the number of differently linked StitchIt segments a peak is split into. The y-axis holds the frequency for the individual counts. The color code indicates whether StitchIt associations are fully supported by conformation data, partially supported or not supported at all. (C) The overlap of STITCHIT REMs to the SEdb [18], a database for superenhancers, is shown for all STITCHIT REMs that split a Unified-Peak (grey) and for randomly picked genomic regions. The actual REMs have a higher ratio score, indicating that there are more REMs per superenhancer compared to the random data. (D) Example for a split event at the TMEM14C locus. At the promoter of TMEM14C, a peak that is linked to TMEM14B is split into several StitchIt segments. These are associated to PAK1P1, TMEM14C itself, and TMEM14B. All StitchIt associations shown here are supported by ChIA-PET data.

