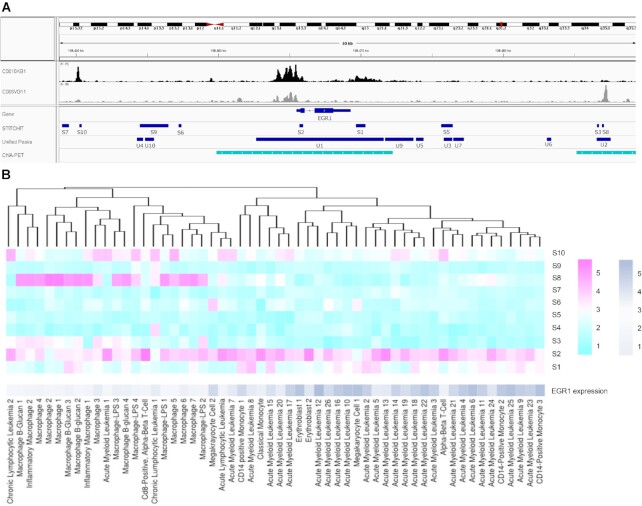
Figure 6.
(A) Genome browser tracks describing the regulation of EGR1. Track C0010KB1 (black) exemplifies the DNase1-seq signal for a sample where EGR1 is expressed, whereas track C005VG11 (gray) illustrates the case where EGR1 is not expressed. (B) Heat map that is clustered according to the DNase1-seq signal in the candidate REMs S1...S10 identified by StitchIt, the gene-expression of EGR1 is not used for the clustering itself and shown for illustration purposes only. The data has been log transformed with a pseudo-count of 1. Two major clusters can be observed corresponding to samples where EGR1 is expressed and to those samples where EGR1 is not expressed. The heatmap shows the log2 of read counts for DNase1-seq, and log2 of TPM for gene-expression, respectively.

