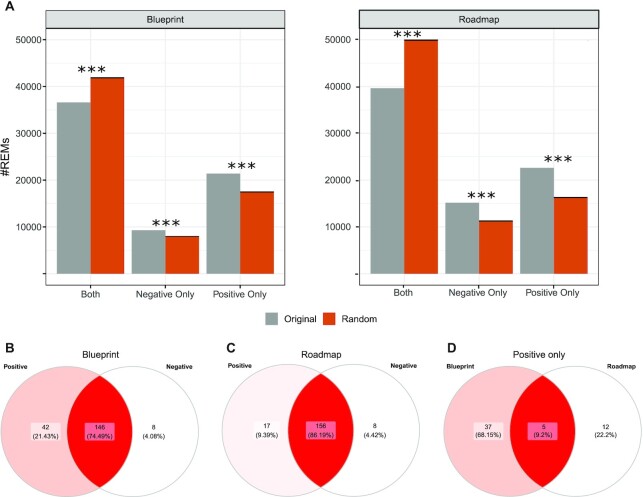
Figure 7.
(A) Number of StitchIt REMs that are associated to multiple different genes in either a positive, negative, or in both ways compared against a random background model using randomly shuffled coefficient distributions. Venn Diagrams depicting the overlap of TFs found enriched in positively and negatively associated REMs for (B) Blueprint, and (C) Roadmap data. (D) Overlap among all TF sets enriched in REMs with positive association across the considered data sets.

