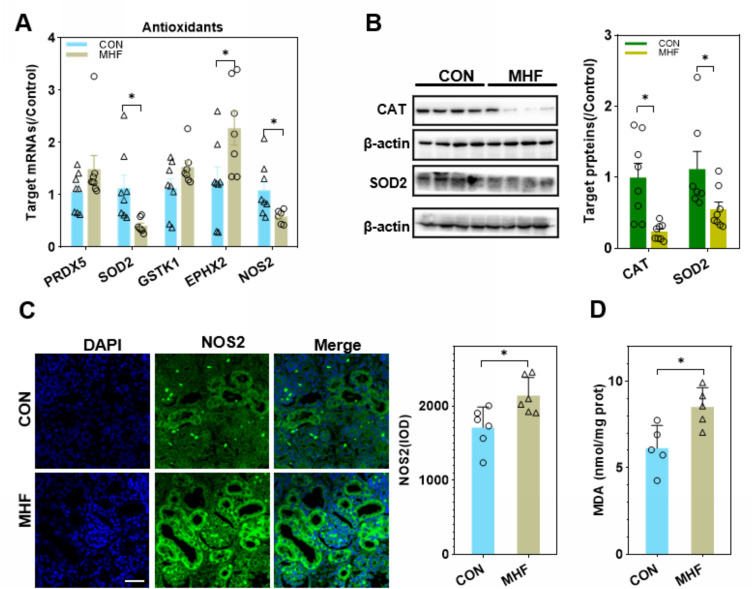
Figure 4.
Effects of MHF on antioxidants in the fetal kidney. (A) The qPCR analysis of the mRNA level of antioxidants in both groups. (B) Protein expression of the antioxidants CAT and superoxide dismutase (SOD)2. (n = 7–8 per group, *p < 0.05 vs control). (C) IF staining showing the locations and expression of nitric oxide synthase (NOS)2 in the fetal kidney of CON and MHF group (400×, scale bar = 50μm, n=6 per group, *p < 0.05 vs control). (D) MDA levels in the fetal kidney of both groups. (n = 5 per group, *p < 0.05 vs control).

