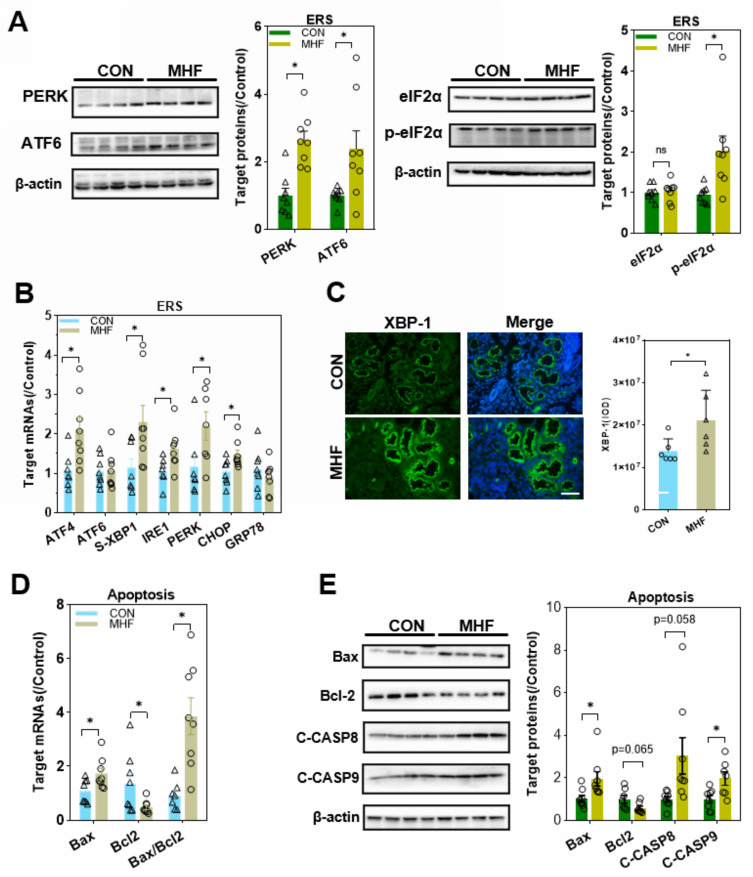
Figure 8.
Effects of MHF on endoplasmic reticulum stress (ERS) and apoptosis regulators in the fetal kidney. (A) Protein expression levels of ERS regulators in the fetal kidney. (n = 7–8 per group, *p < 0.05 vs control). (B) The qPCR analysis of the mRNA levels of ERS regulators (C) IF staining showing the expression and location of XBP-1 (400×, scale bar = 50μm, n=6 per group, *p < 0.05 vs control). (D) The qPCR analysis of the mRNA levels of Bax and BCL-2 in the fetal kidney. (E) Protein expression of apoptosis regulators in the fetal kidney. (n = 7–8 per group, *p < 0.05 vs control).

