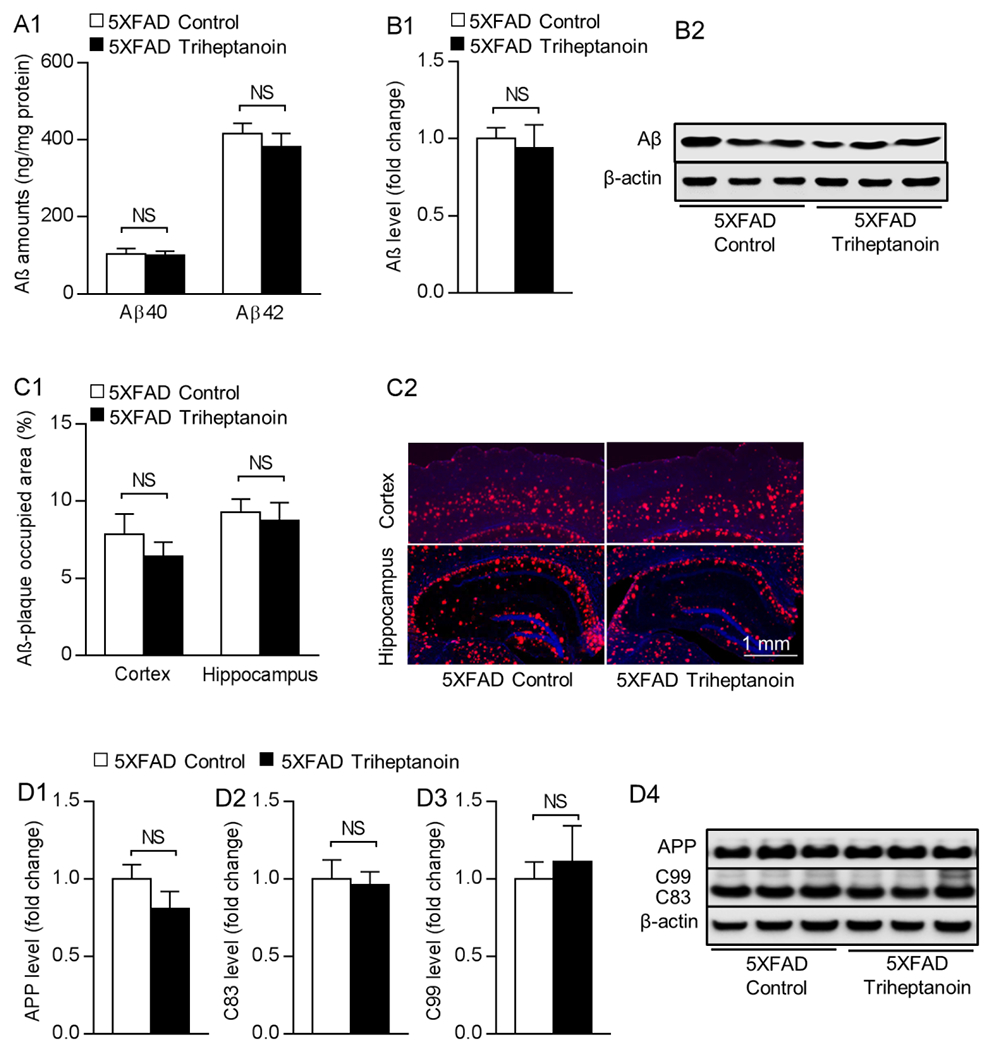
Fig. 3. Triheptanoin treatment has no effect on 5×FAD mice Aβ level.

(A) Measurement of cortical Aβ 1-40 and 1-42 levels from nonTg and 5×FAD mice with control or triheptanoin diet treatment using ELISA. Unpaired student’s t-test. n = 5-6 mice per group. NS, not significant. (B1) Immunoblotting of brain Aβ from nonTg and 5×FAD mice with control or triheptanoin diet treatment. Unpaired student’s t-test. n = 6 mice per group. NS, not significant. (B2) are the representative bands of immunoblotting. (C1) Measurement of Aβ deposition using immunostaining in cortex and hippocampus from nonTg and 5×FAD mice with control or triheptanoin diet treatment. Unpaired student’s t-test. n = 6-7 mice per group. NS, not significant. (C2) are the representative images, scale bar = 1 mm. (D1-D4) Immunoblotting of APP (D1) and its cleavage productions includingC83 (D2), C99 (D3) in entorhinal cortex from 5×FAD mice with control or triheptanoin diet treatment. Unpaired student’s t-test. n = 5 mice per group. NS, not significant. (D4) are the representative bands of immunoblotting.
