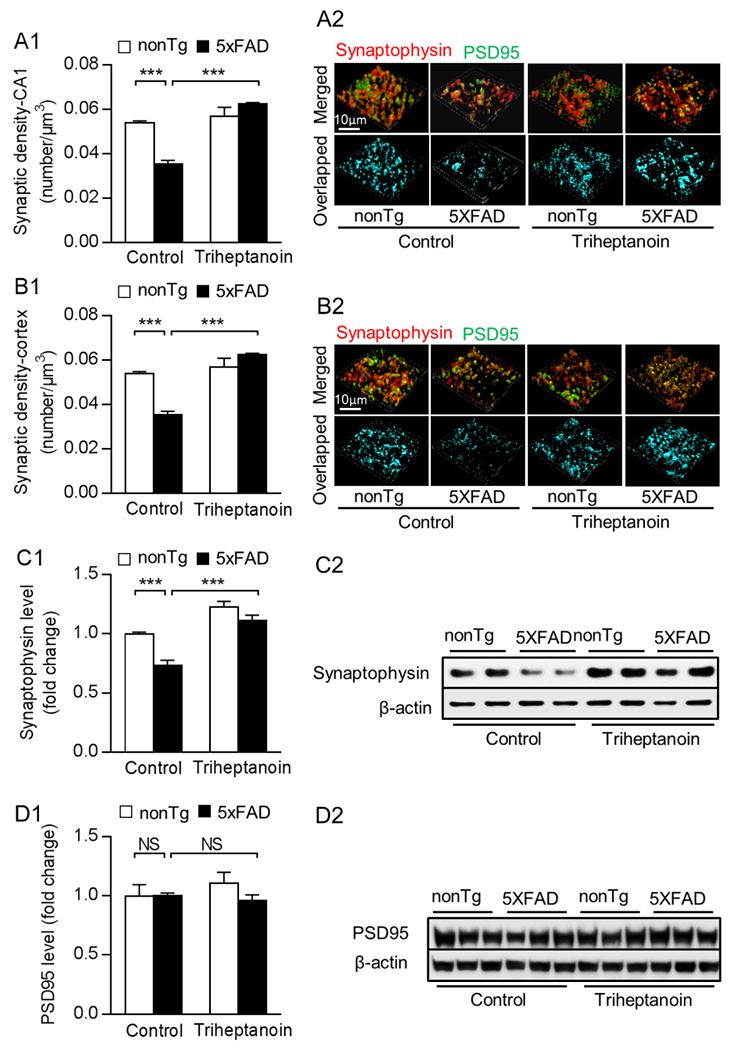
Fig. 4. Triheptanoin treatment preserves synaptic density in 5×FAD mice.

(A1&B1) Analysis of synaptic density in the hippocampal CA1 region (A1) and entorhinal cortex (B1) from nonTg and 5×FAD mice with control or triheptanoin diet treatment. Two-way ANOVA followed by Bonferroni post hoc analysis. n = 5 mice per group. *** P < 0.001. (A2&B2) Representative 3D-reconstructed images of synapse staining. Synaptophysin (red) and PSD95 (green) were used to visualize pre- and post-synaptic components, respectively. The overlaid staining (light blue) of synaptophsyin and PSD95 indicates synapses. scale bar =10µm. (C1&C2) Immunoblotting of synaptophysin (C1) in entorhinal cortex from nonTg and 5×FAD mice with control or triheptanoin diet treatment. Two-way ANOVA followed by Bonferroni post hoc analysis. n = 5 mice per group. ** P < 0.01, *** P < 0.001; NS, not significant. (C2) are the representative bands of immunoblotting. (D1&D2) Immunoblotting of PSD95 (D1) in entorhinal cortex from nonTg and 5×FAD mice with control or triheptanoin diet treatment. Two-way ANOVA followed by Bonferroni post hoc analysis. n = 3-4 mice per group. NS, not significant. (D2) are the representative bands of immunoblotting.
