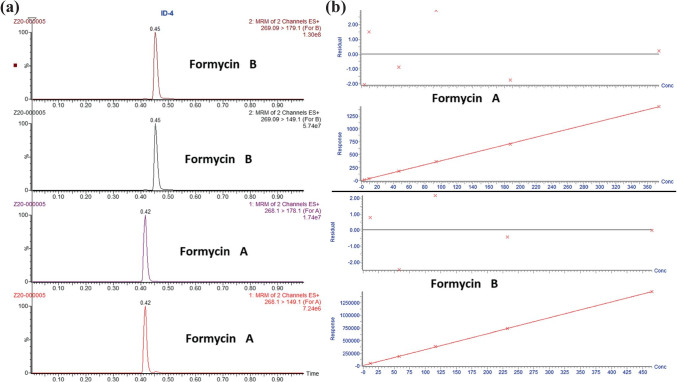
Fig. 4.
(a) Example of chromatograms of formycin A (two lower chromatograms) and formycin B (two upper chromatograms) obtained in the quantification of both compounds in the cellular uptake experiments using ultra-performance liquid chromatography–tandem mass spectrometry, showing their retention time under conditions described in “Materials and methods”. (b) Two upper panels: calibration curve and residuals plot formycin A. Two lower panels: calibration curve and residuals plot formycin B

