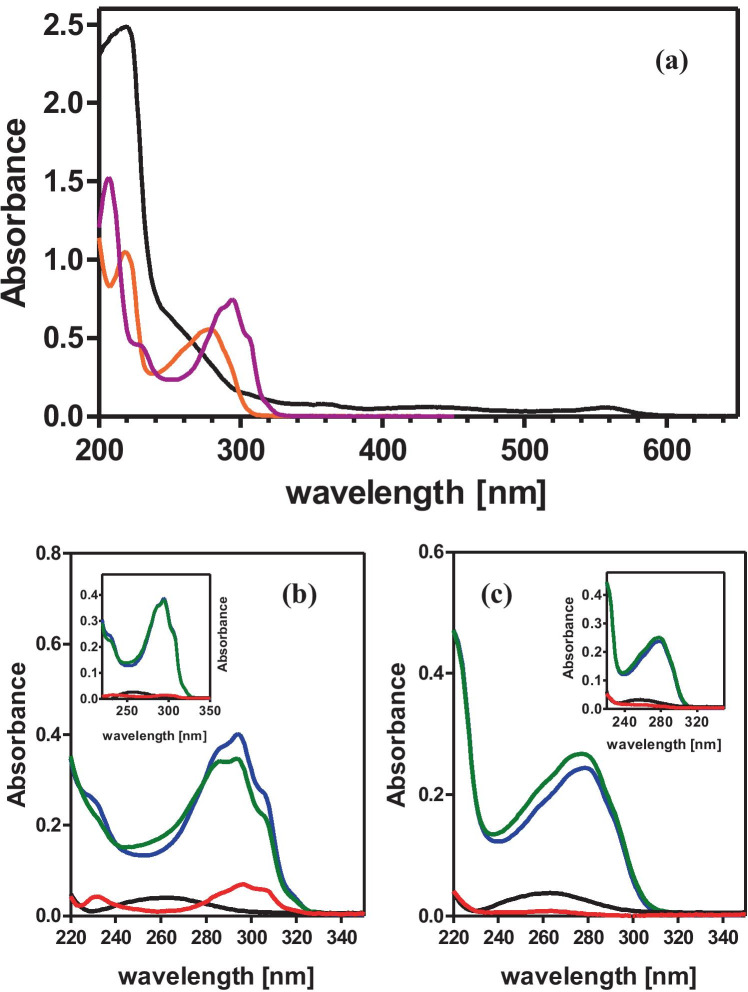
Fig. 5.
(a) UV spectra of F12 medium ten-fold diluted with water (black), and 70 µM water solution of formycin A (magenta), and formycin B (orange). (b) Cellular uptake of formycin A, and (c) formycin B, both at concentrations of 350 µM, by H. pylori 26695 strain after 8 h incubation, quantified by UV absorption spectra of ten-fold water diluted supernatants obtained from the cellular uptake experiment (see text for details of the method). F12 medium contained the following supplements: inhibitor (blue), inhibitor and H. pylori 26695 strain (green), H. pylori 26695 strain cells (black), and difference spectra (red), obtained by subtraction of green and black spectra from the blue (blue spectrum-green spectrum-black spectrum), which shows the inhibitor uptake. Main figure and the respective insert show data obtained for samples incubated at 37 °C and at 4 °C, respectively

