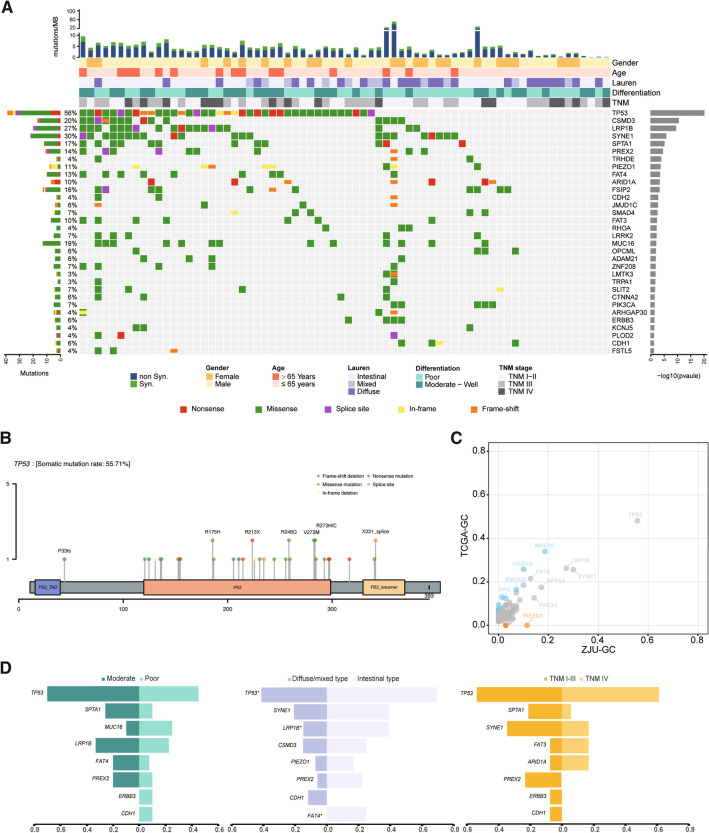
Fig. 1.
The landscape of somatic mutations in ZJU-GC cohort. A Somatic mutations of 70 paired samples in ZJU-GC cohort. The middle matrix shows the somatic mutations by gene (row) and by sample (column). The top histogram shows the number of non-synonymous and synonymous mutations in each individual sample. The top tracks show the clinicopathological characteristics, including gender, age, Lauren types, differentiation, and TNM stage. The left histogram shows the number of somatic mutations accumulated on 70 ZJU-GC samples in each gene. The right histogram shows p values of each gene calculated from MuSic analysis. B Distribution of non-synonymous TP53 somatic mutations identified. C Comparison of gene mutation rate between ZJU-GC cohort and TCGA-GC. Orange or blue dots represent the genes with significantly higher or lower mutation rate, respectively. D Comparison of gene mutation rates by clinicopathological subtypes

