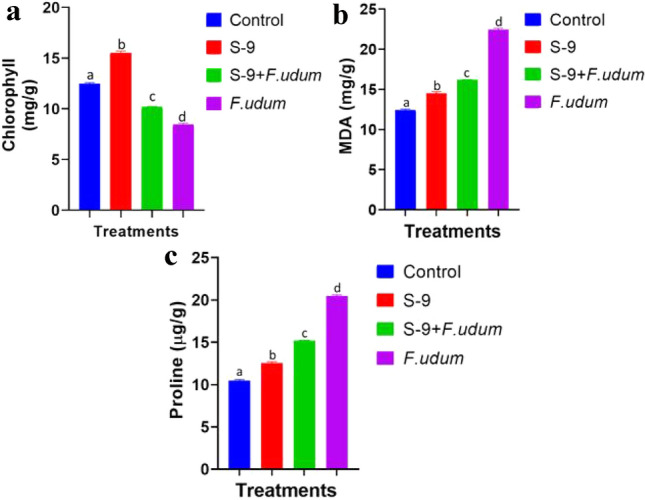
Fig. 5.

a–c Chlorophyll, proline, and MDA content in Pigeon pea leaves. The data obtained were statistically analysed using one-way ANOVA and Duncan’s Multiple Range Test using SPSS (Version 20). Differences were considered statistically significant at P ≤ 0.05. Data were presented as mean ± standard error of the mean (SEM) of five replicates except otherwise stated. The graph were prepared using Graphpad Prism (Version 8)
