
Figure 2.
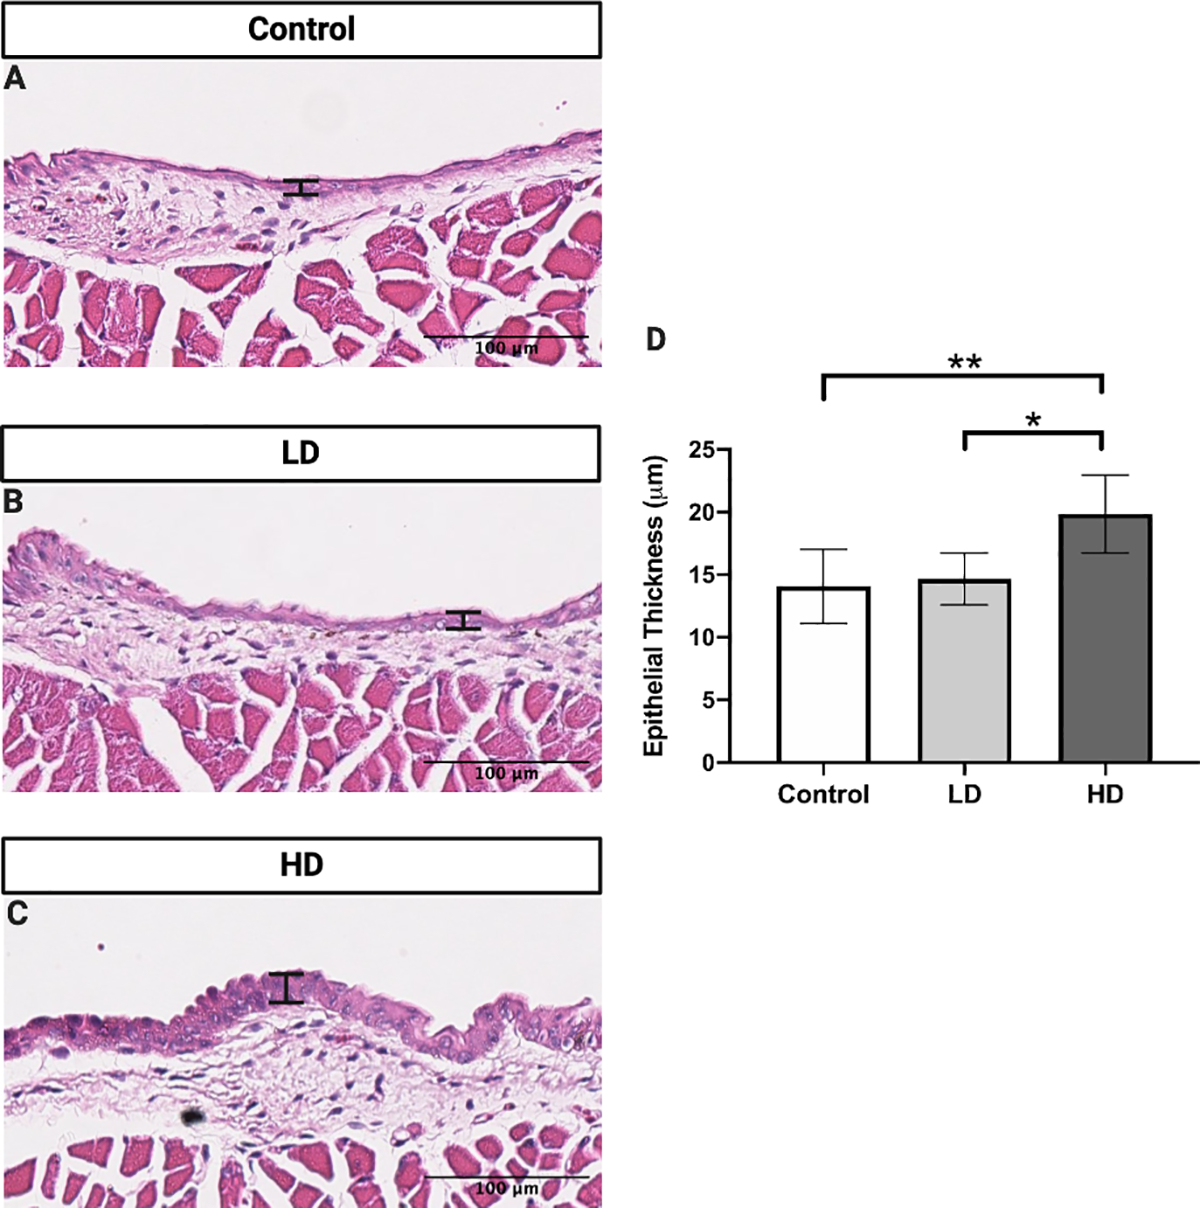
VF epithelial thickness following control (A), LD (B), and HD (C) CSE. VF epithelial thickness was significantly increased following HD CSE when compared to control and LD CSE (D). N=5 in control group. N=4 in LD group. N=6 in HD group. H&E stained images are at a magnification of 200x. Bar graph shows the mean with standard deviation (SD). * indicates p ≤ 0.05. ** indicates p ≤ 0.01.