
Figure 1.
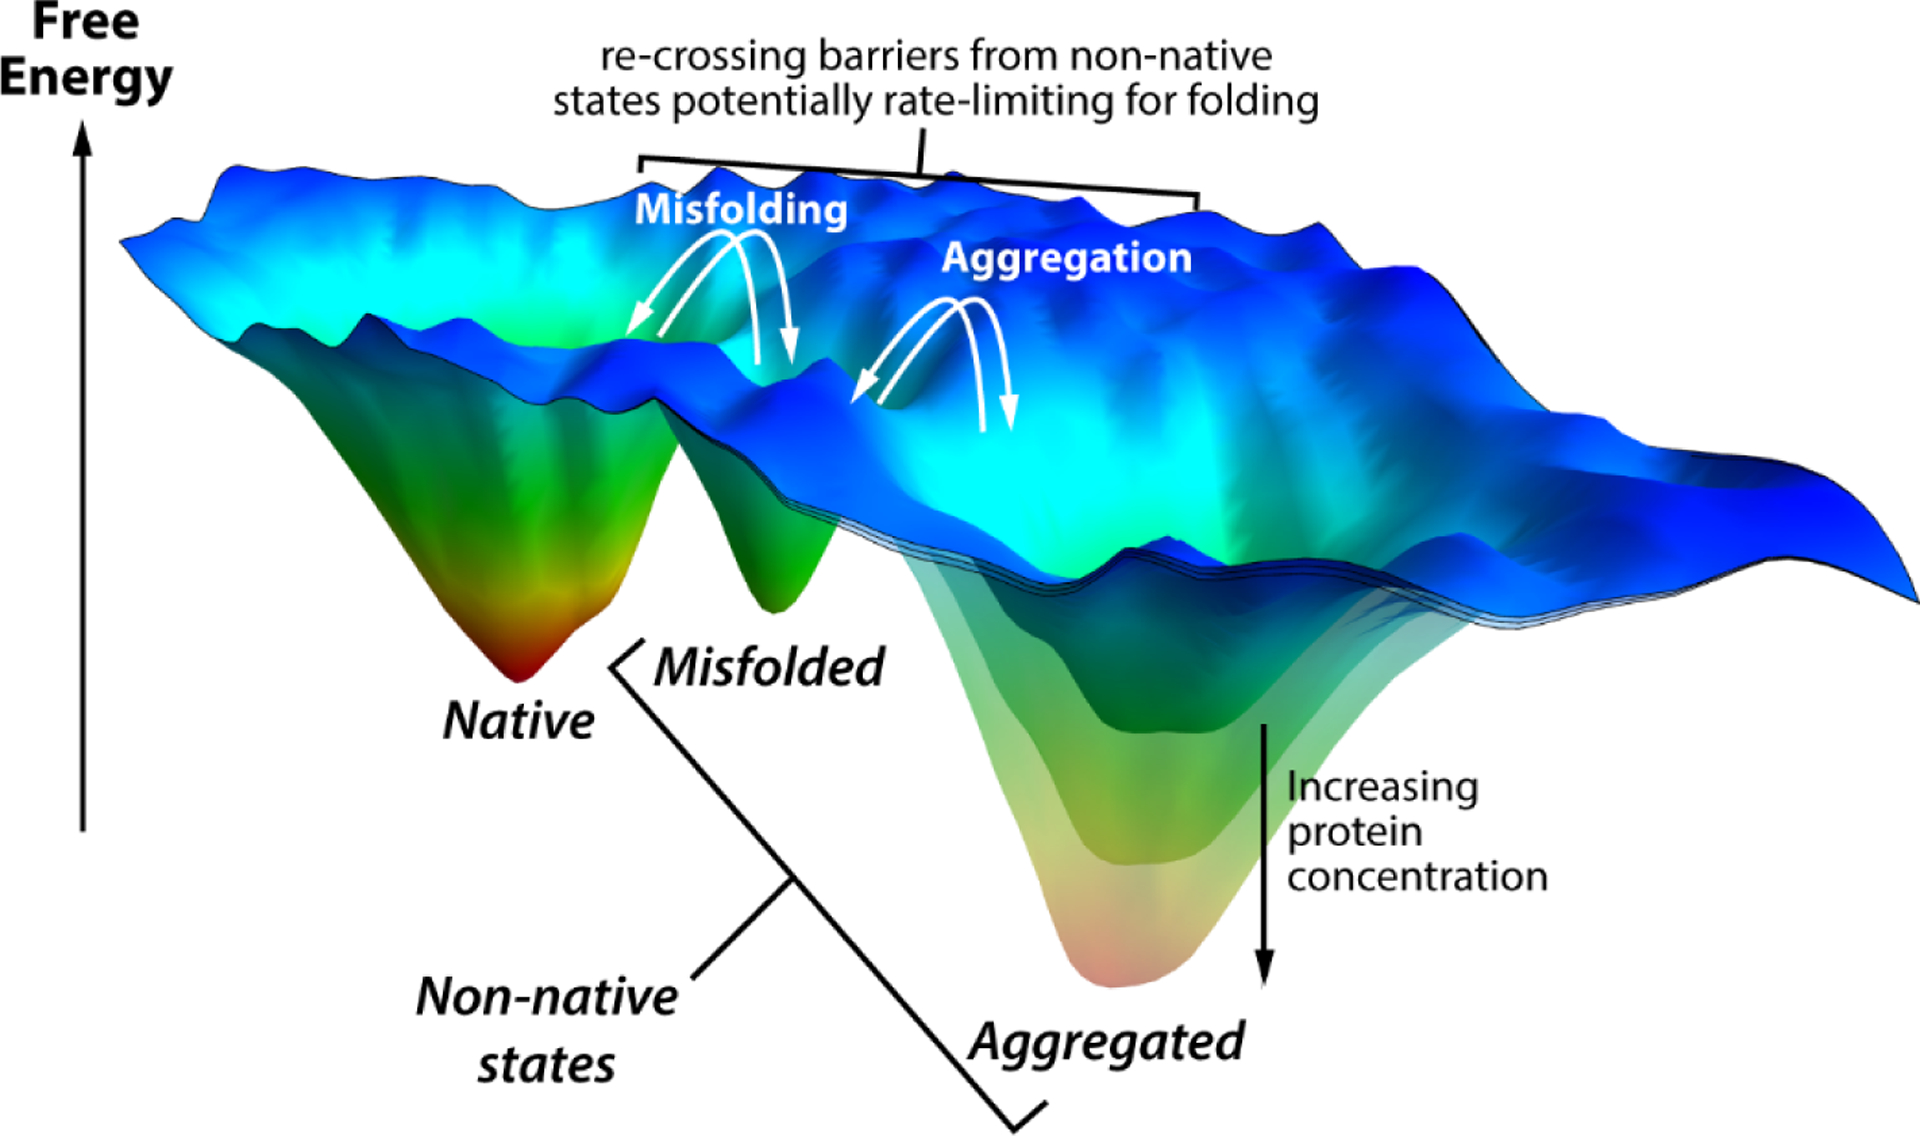
Protein folding energy landscape with multiple minima, following the depiction by Clark [15]. The blue areas represent the unfolded state, while the three energy wells shown represent the native state and two non-native states (a misfolded monomer and an aggregated state, as labeled). The aggregated state becomes more stable as the protein concentration increases. Protein that enters the non-native states may have to cross significant energy barriers to reach the native state, making these steps potentially rate-limiting for folding.