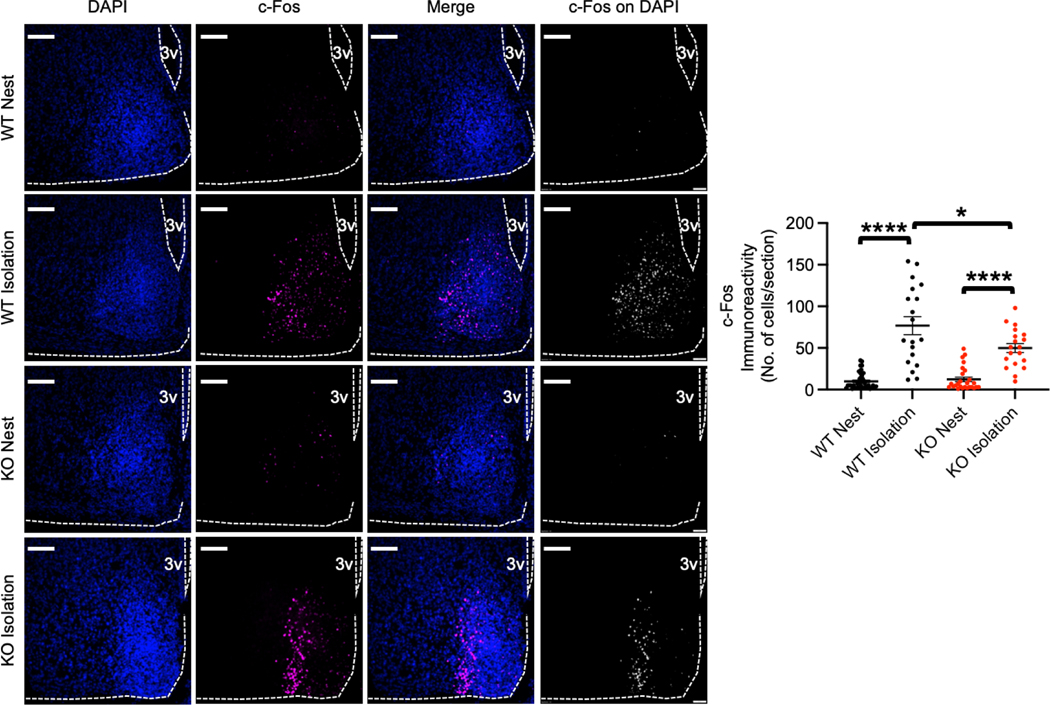
Figure 4. Reduction of neuronal activation in the arcuate nucleus in isolated cGKII KO pups.
Left panels: Representative c-Fos immunoreactivity (Magenta), DAPI (Blue), merge images, and c-Fos signals colocalized with DAPI images in each condition. The graph on the right shows that neuronal activation is significantly reduced in the KO arcuate nucleus following isolation from the nest (n= WT Nest; 39 sections from 4 animals, WT Isolation; 19 sections from 4 animals, KO Nest; 26 sections from 4 animal, and KO Isolation; 19 sections from 4 animals, *p<0.05 and ****p<0.0001, Kruskal-Walls test, Dunn test). A scale bar indicates 100μm. 3V, the third ventricle.

