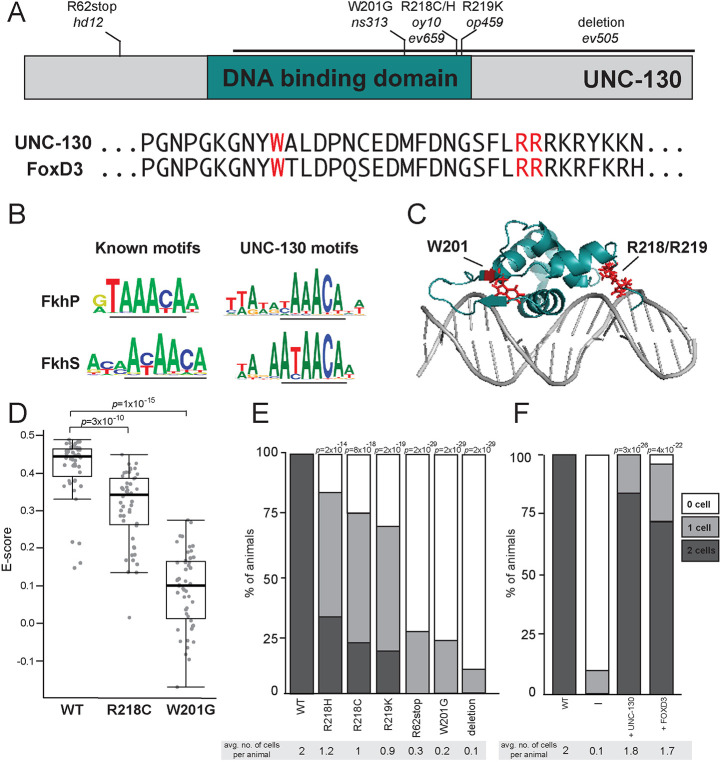
Fig. 5.
Severity of glial phenotypes correlate with UNC-130:DNA-binding defects. (A) Schematic diagram of UNC-130 protein with DNA-binding domain (turquoise) highlighted. Location of point mutations and a deletion are indicated. Alignment of UNC-130 and FoxD3 DBD with point mutations highlighted in red. (B) Logos of vertebrate primary (FkhP, top) and secondary (FkhS, bottom) Forkhead motifs and UNC-130 preferred DNA sequences that resemble primary (top) and secondary (bottom) motifs, as determined by this study. Core motifs are underlined. (C) Structure of FoxD3 DBD (turquoise) interacting with DNA (gray) (Protein Data Bank, https://www.rcsb.org; ID code 2HDC; Jin et al., 1999). W201, R218 and R219 residues are highlighted in red. (D) Scatter plot of E-scores for 8-mer DNA sequences matching [A/G][C/T]AAACA or AA[C/T]AACA from protein-binding microarray assays of wild-type, R218C and W201G mutant UNC-130 proteins. Black lines represent population median; top and bottom of boxes are 25th and 75th percentiles, respectively; and top and bottom of whiskers are either most extreme point or 1.5× the interquartile range. P-values were calculated by Mann–Whitney test. (E) Percentage of animals expressing grl-18pro:YFP in zero, one or two ILsoD glia in wild-type and unc-130 mutant strains. Average number of cells marked per animal is listed under each condition. n=50 animals per genotype. P-values were calculated by Fisher's Exact test. (F) The unc-130 promoter was used to drive expression of unc-130 and human FOXD3 separately in the unc-130 mutant strain and the extent of rescue was assessed. Percentage of animals expressing grl-18pro:YFP in zero, one or two ILsoD glia in each condition. Average number of cells marked per animal is listed under each condition. n=50 animals per condition. P-values were calculated by Fisher's Exact test.

