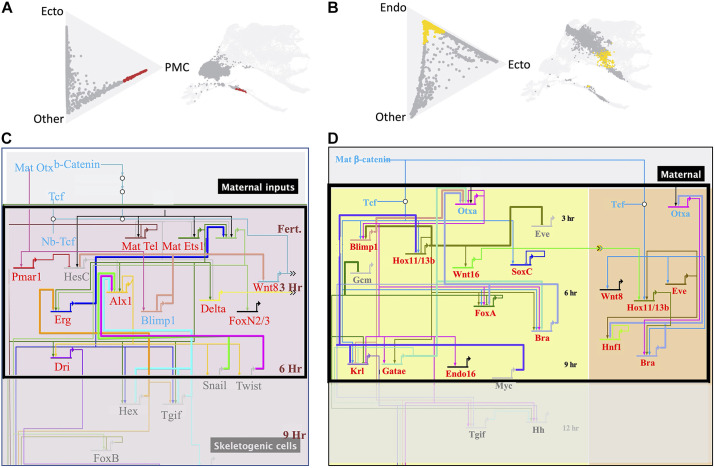
Fig. 6.
The predictive value of Waddington-OT plots relative to published dGRNs. (A) Future PMCs at 6 hpf. The cells in red have >50% probability of becoming PMCs, while those in gray have either not reached that level of probability or are specified towards other fates. Those cells also are shown on the UMAP plot. (B) Future endoderm seen at 9 hpf in yellow (>50% probability). All other cells are shown in gray. (C,D) dGRNs of PMCs (C) and endoderm (D) with the boxed areas showing genes expressed at 6 hpf and 9 hpf, respectively. Genes in red are highly differentially expressed in the top 200 list of genes when the genes in the red versus gray (or yellow versus gray) cells are compared. 73% of the genes in the PMC dGRN are in the highly differentially expressed list; 71% of the endoderm genes are in the top 200 gene list for endoderm. The remaining genes (27% and 29%) in blue are present in the PMC and endoderm gene lists, but not in the top 200 differentially expressed genes because either they are ubiquitously expressed or expressed in another cell type at that time. Genes in the dGRNs colored gray are not represented in the 6 hpf PMC or 9 hpf endoderm gene lists because those genes are either repressed or not yet expressed by the cells.

